The report “The N conductor & Harmonics” already explained the special features of the The report “The N conductor & Harmonics” already explained the special features of the harmonics divisible by 3 and why they add up on the neutral conductor. This special publication intends to illustrate a typical power quality measurement and the aspects, which should be taken into consideration conducting the measurements. The measurements displayed in this report took place in an office building where increasing problems with the power quality were detected.
If power quality problems occur, an evaluation according to IEC 61000-2-2 is necessary
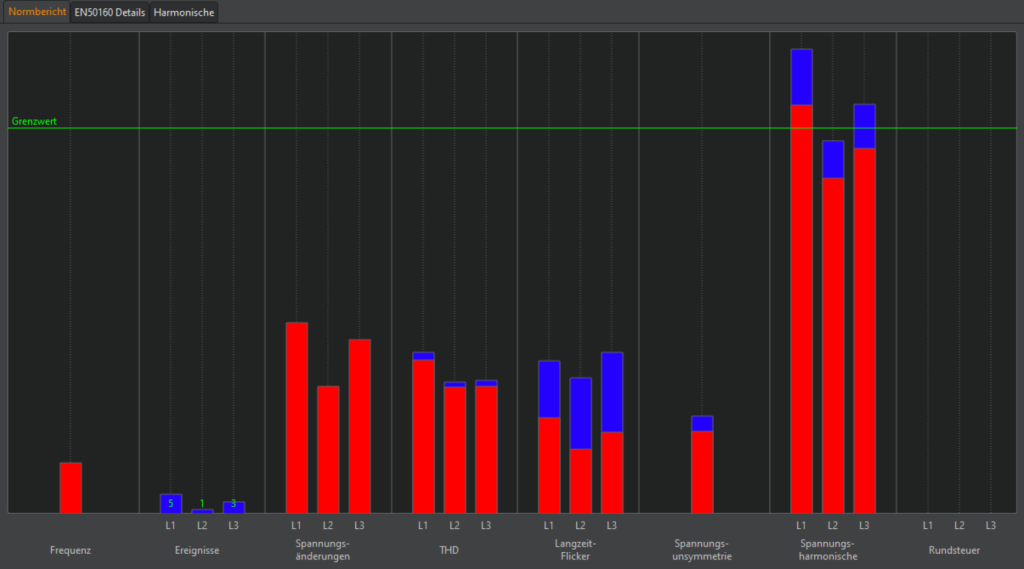
Figure 1 shows an evaluation generated from our WinPQ mobile software. This evaluation represents a one-week measurement according to EN 50160/IEC 61000-2-2 in the grid of an energy supplier at a handover point to a larger office building. Measuring all parameters according to EN 50160, more than 500,000 values are recorded, which are statistically processed by the WinPQ mobile software. Since some devices in this office building are overloaded and fail after a short period, the tenant of the office building ask for an evaluation of the cause of this problem. In this diagram, all measured values are shown scaled to the compatibility values according to EN 50160. All bars that are below the limit line are uncritical. The values for voltage harmonics on phase L1 and L3 exceed the limit values and therefore further investigations should be conducted. However, this chart does not provide the required information to evaluate which frequencies have led to a limit value violation. Further data evaluation is required.
The examination of limit values is essential for the evaluation of power quality problems
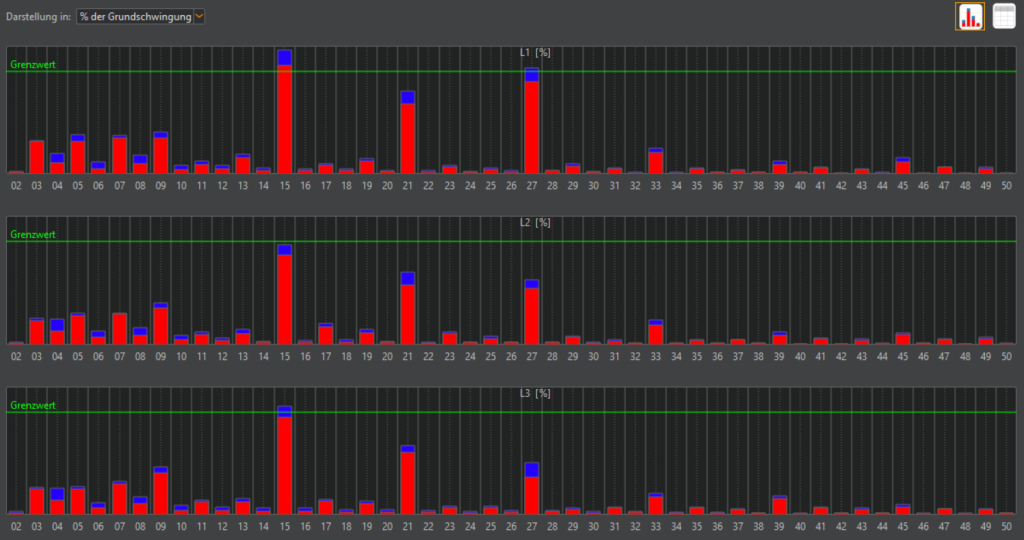
Taking a closer look at the limit values of the individual harmonics as in Figure 2, three peculiarities stand out:
- The 15th harmonic is violated on phase L1.
- On phase L2 the value is still just below the compatibility values.
- The value of the 15th harmonic is violated on phase L3.
As already described in the previous article, the odd-numbered harmonics 21, 27 and 27, which are divisible by three, also stand out
The excact date of the limit exceedance gives important information about the cause of the problems
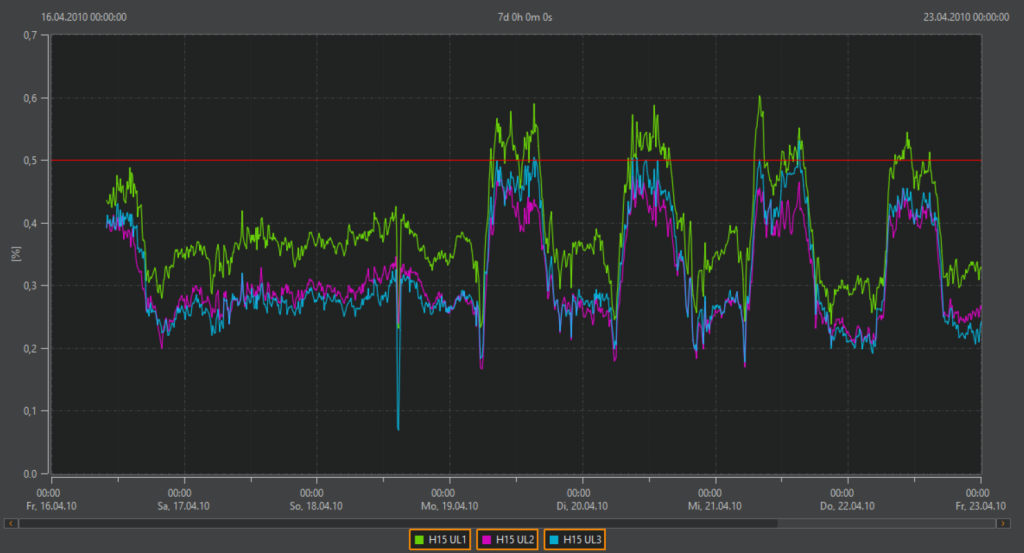
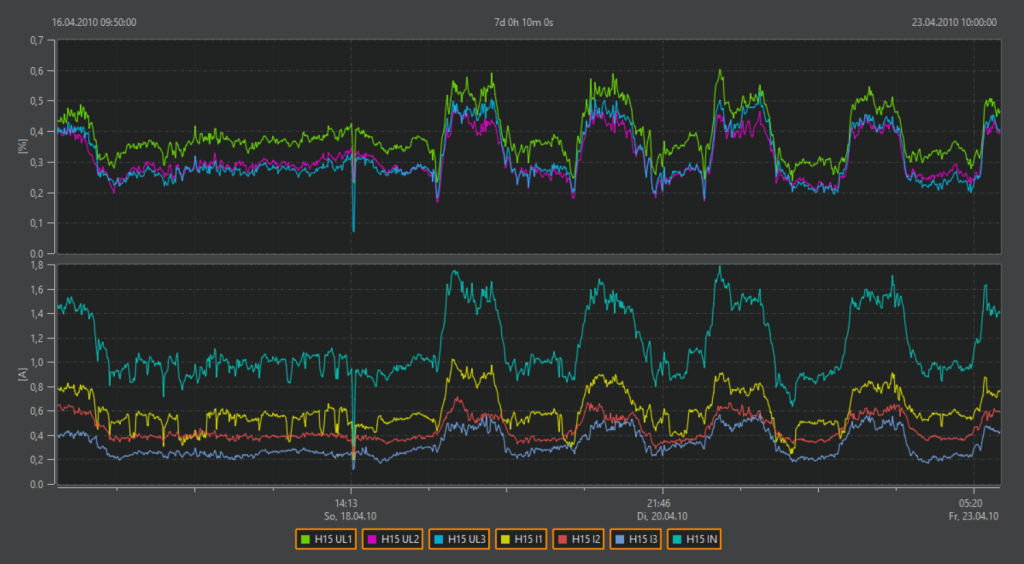
By considering the gathered knowledge, the next step contains a check at which times the violation of the limit values took place. At this point, it is essential that the measurement runs over a week, even though there is no activity in the office building at the weekend. Scaling the data of the 15th harmonic to a week, the data suggest that the levels are at the same low level during the weekend and during the night. From Monday morning the levels rise somewhat and fall again towards evening. By setting markers on the high and low points, the evaluation software shows that the levels are elevated between 06:50 and 16:40 – the typical office hours when employees are in the building
The current harmonics give a hint about the location of the problems
By investigating the currents, it could be detected if the disturbance is caused in front of or behind the measuring point. If the office equipment with all the appliances is the cause of the harmonic, this the current harmonic could help to detect this fact. So, in addition to the 15th voltage harmonic, the 15th current harmonic should also be investigated. Figure 4 displays, that the neutral conductor is the highest load and corresponds approximately to the sum of the three phases. The 15th current harmonic, divisible by three, adds up on the neutral conductor. Taking a closer look at the weekly profile, direct correlations with the voltage curve can be ascertained: The higher the current harmonics, the higher the voltage level in the grid. This effect can also be seen with other harmonics. Unlike the current levels, one cannot assume that the voltage levels will drop to zero, because the voltages or feedbacks are the sum of all the consumers working in the grid, and at the weekend a large number of consumers are certainly active. Even a transformer in no-load operation produces some harmonics. With view at the limit values, it could be said that they are not exceeded at night and on weekends. Only during operating hours in the office, when many single-phase consumers are operated, the limit levels are exceeded.
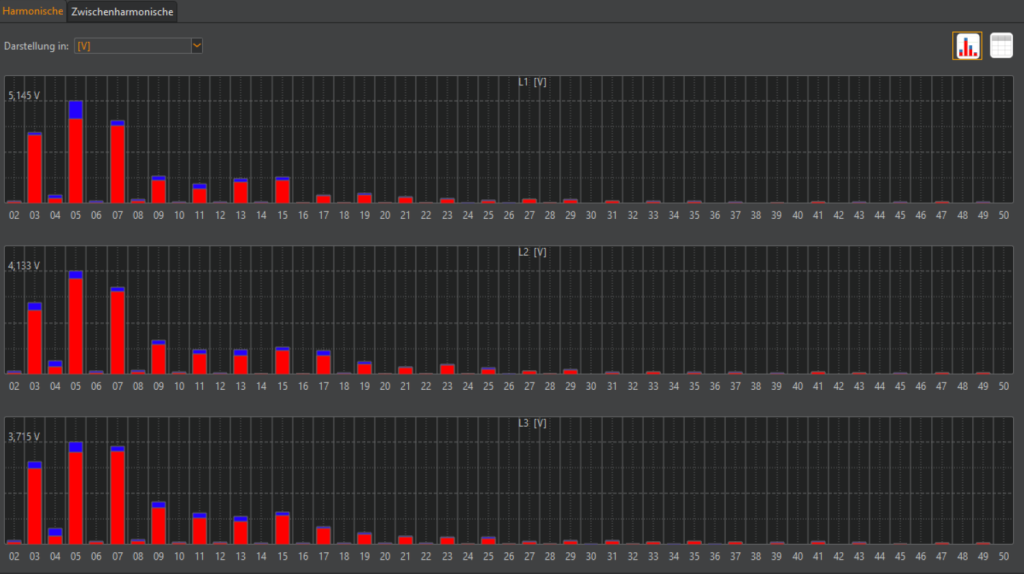
The limit value evaluation is very simple using the WinPQ mobile
For users of the WinPQ mobile, there are also several different display options for the values. Figure 5, for example, shows the deviation of the measured value from the corresponding compatibility value in %. Of course, much smaller limit values apply to a 15th harmonic than to a 5th harmonic. Using the WinPQ mobile software, however, it is no problem to have the absolute values displayed in volts, as can be seen in Figure 6. In this figure, the 15th harmonic is not noticeable at all, but to note a limit violation, the user needs to know all limit values for each harmonic.

Conclusion
This measurement proved the customer’s influence on the increased voltage reading of the 15th harmonic. Due to the many single-phase consumers in this office building, the limit value was exceeded. Actions were taken to improve the power quality in the customer’s building.
Author
Jürgen Blum, Product Manager Power Quality Mobile