Today’s devices and equipment such as switched-mode power supplies, frequency converters, controlled drives, charging devices for e-mobiles or LED lighting work internally with high clock frequencies in order to regulate power efficiently. These can lead to line-borne as well as field-borne (coupled) interference in the power grid. In this technical report, we explain how you can detect these sources of interference in the grid using suitable measurement technology.
The change in energy technology
The reason for energy efficiency and cost savings
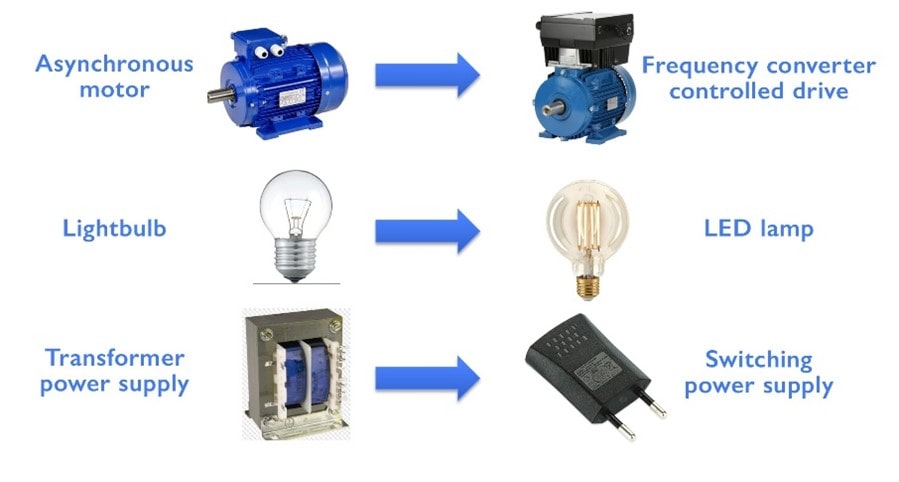
In order to use energy more efficiently, we now control many things via power electronics. For example, an asynchronous motor is often replaced by a frequency converter-controlled drive, or a device is equipped with a switched-mode power supply instead of a transformer.
As a rule, the new device technology, unlike the old technology, no longer draws a sinusoidal current from the mains. Power quality measuring devices break down this current into the spectrum of all frequencies. In power quality measurement, we now divide mains perturbations into harmonics, interharmonics and, more recently, superharmonics.
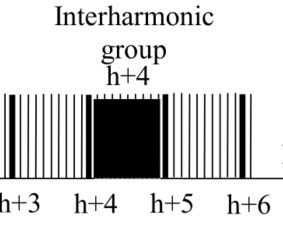
We define harmonics as multiples of the fundamental (example 250Hz = 5th harmonic in a 50Hz fundamental). If frequencies lie between two integer multiples of the fundamental, we call them intermediate or interharmonics. In power quality measurement technology as well as in the standards, all interharmonics of a range are usually combined into one value (example: all frequencies between >350Hz and <400Hz are included in the 7th interharmonic).
High frequencies above 2.5 kHz up to 150 kHz are often called supraharmonics. Oh yes, there are also subharmonics. These are frequencies lower than the fundamental, which can often lead to glitching
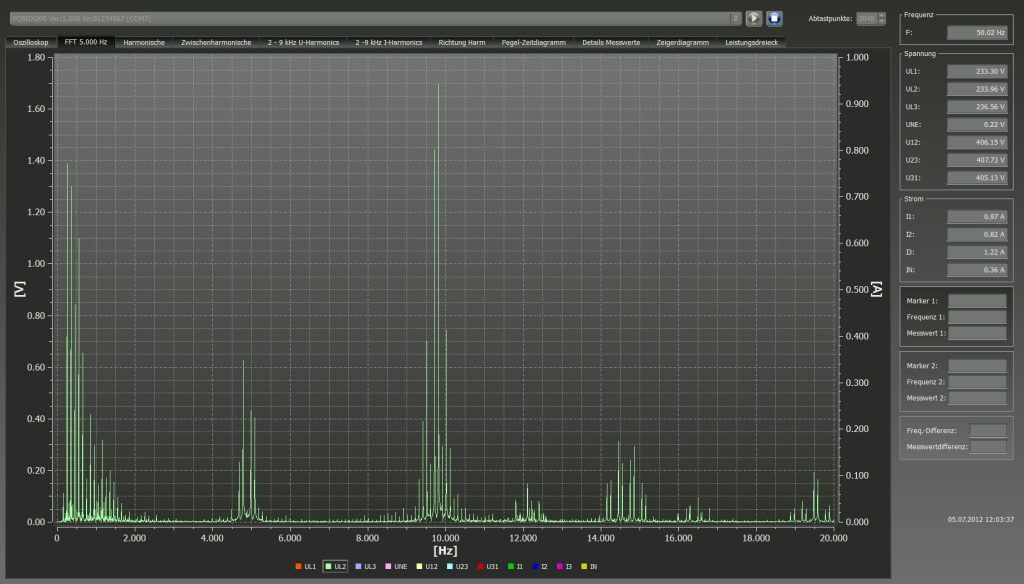
The picture shows a frequency spectrum of the voltage from DC to 20 kHz in a public grid. Harmonics as well as supra-harmonics can be seen, which in this case were generated by a frequency converter controlled drive. The highest levels here are at 10kHz with approx. 1.8V.
Typical cycle frequencies of systems and devices that we have to reckon with in our networks today:
- Frequency inverter drive: 4kHz to 20kHz
- Solar inverter (400V): 16kHz to 22kHz
- WK system (MV grid): 2kHz to 6kHz
- E-Mobile: 10kHz to 80kHz
- Active mains filters: 8kHz to 20kHz
- UPS systems: 15kHz to 25kHz
- EVG luminaires: 20kHz to 200kHz
- Switched-mode power supplies: 30kHz to 300kHz
Where do these high switching frequencies in our electrical loads come from?
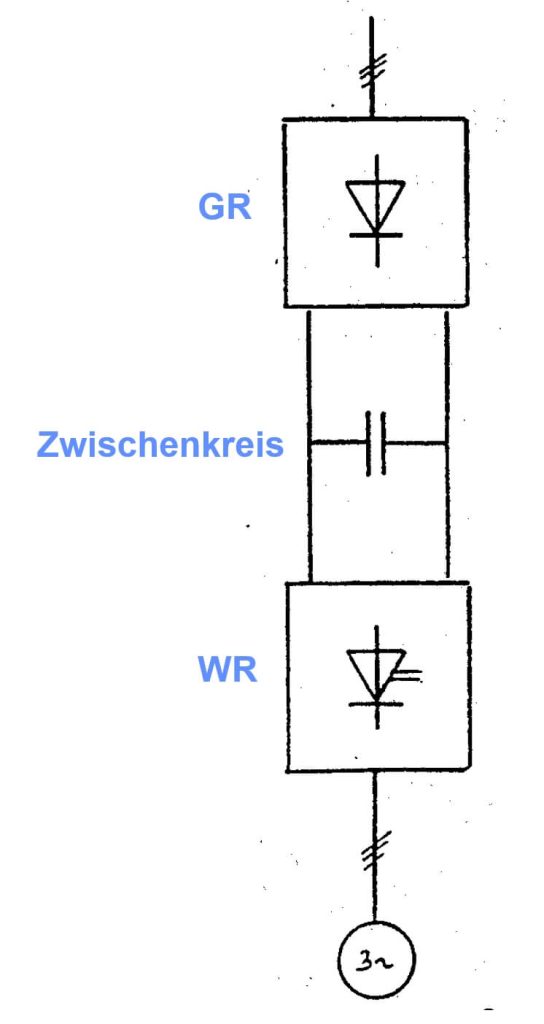
Example: A bridge rectifier at the input of a CNC machine rectifies the three phase voltages to a DC voltage. This DC voltage is broken down into pulses with different pulse-pause times at a certain cycle frequency to produce a sinusoidal current in the electrical load. This is called “sinusoidal pulse width modulation”. The speed of the motor can be controlled in this way. Loads with very high power, such as a wind turbine, usually have a low switching frequency, while low-power systems operate with much higher cycle frequencies.
The picture shows a diagram of the structure of a frequency converter controlled drive, which consists of a rectifier, a DC link and an inverter.
These cycle frequencies and their sidebands can be detected in the mains current as well as in the mains voltage, which is mapped via the mains impedance.
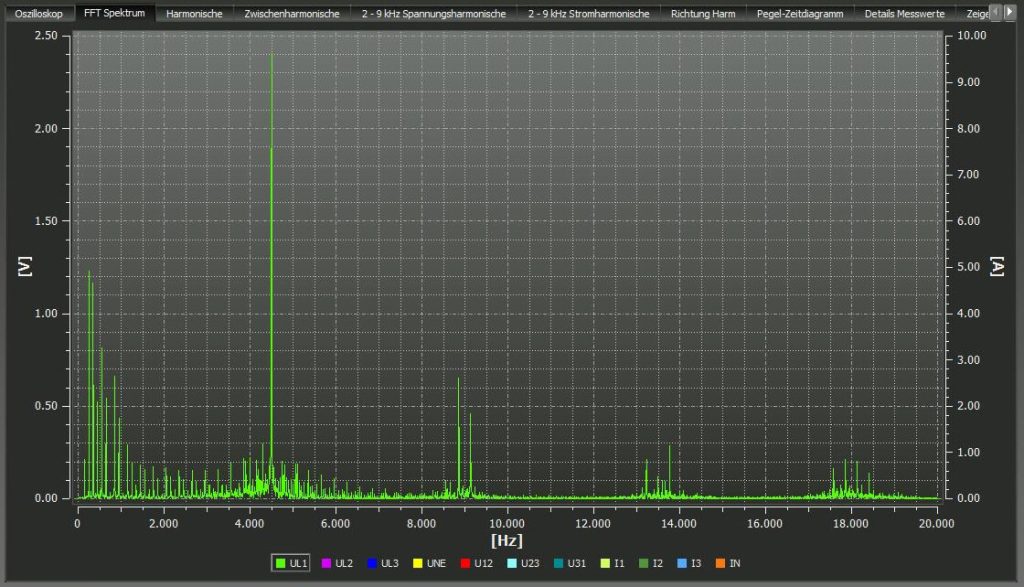
In the example (Fig. 5) we see the frequency spectrum of the voltage of a load with a cycle frequency of 4.5 kHz at 2.5 V of an industrial plant. A drive operates with this switching frequency. However, this is not the only frequency that is represented in the energy network. There are other frequencies that we receive as a network reaction from this system. With the help of the formula, we get all multiples of the switching frequency and its sidebands calculated.
f_{μ} = n *f_{T} ± 2_{n} * f_{1}n = 1, 2, 3…
fμ = Cycle frequency of the inverter
f1 = fundamental frequency mains (50Hz)
In our example, this system imprints not only the 4.5kHz but also all multiples of it. Here of 9kHz, 13.5kHz; 18kHz… into the network, as well as additionally their sidebands of +/-100Hz; +/200 etc.
What are the problems we face?
The following problems can now occur in the network due to the supraharmonics:
1. Malfunction of devices
More and more loads are controlled by very small control signals of higher frequency. Now it can happen that a higher frequency interference signal from a load imprints exactly these frequencies into the network with which another device is controlled. Here is an example: In a hotel that had equipped all rooms with touch dimmer lamps, an industrial company that was producing nearby was able to switch these lamps on and off independently. Since this also happened at night, it was very inconvenient for the overnight guests. In another case, the feedback effects of a solar inverter could cause an automatic milking line for cows on a farm to fail. In both cases, there is no damage, but certain loads in this grid do not function faultlessly.
2. Disruptive ringing noises
Another problem that occurs more and more frequently in our networks is disturbing buzzing or ringing noises from loads. Cycle frequencies are often within the hearing range of the human ear. As a rule, humans can perceive sounds up to a maximum of 16 kHz, but people vary greatly in their sensitivity. From an industrial plant, we are already used to the fact that as soon as a CNC machine is working, for example, a ringing noise from the plant can be perceived. However, if the neighbour across the street hears a ringing from a transformer or lighting equipment possibly even at night, then this can be perceived as very disturbing and a remedy for this disturbance must be sought.
3. Equipment failure or ageing
The load from cycle frequencies of other loads in the vicinity is also a detriment. Currents of higher frequency are strongly attenuated by inductances such as transformers and thus do not want to flow towards the local network transformer. Rather, these switching frequencies seek out other loads in the vicinity that have a low impedance for these high frequencies. Due to the additional current consumption, these loads are heated up more, since the losses increase as the square of the current P = I²xR. Capacitors can be overloaded or at least age more quickly, since they have a very low impedance for high frequencies.
XC=\frac{1}{ω*C}ω=2*π*f
An increased current consumption always means a higher thermal load on the load, which in turn leads to a reduced service life. Why does my LED lamp not last as long as stated on the packaging? Supraharmonics could play a role.
The noise propagation in the network is thus significantly influenced by all devices connected and switched on in the vicinity and less by the line impedances.
A reaction was made in the voltage quality nomenclature.
For a long time, the frequency range from 2.5 kHz to 150 kHz was a standard-free area. The EMC standard IEC61000-2-2 (Environmental conditions – Compatibility levels for low-frequency conducted disturbances in public low-voltage networks) has already reacted and since 2018 has extended the range of limit values from previously 2.5kHz to 30kHz. In 2019, limit values from 30kHz to 150kHz were then introduced and the standard gap was completely closed. Above 150kHz up to at least 30MHz, limit values also apply to the emitted interference of devices and systems. These are checked in a test laboratory in the course of an EMC test for the approval of the device.
This means that today we have a complete range of compatibility levels..
Limits of IEC61000-2-2
| Frequency range (kHz) at 50Hz | Compatibility level in % |
| 2kHz to 3kHz | 1,4% |
| 3kHz to 9kHz | 1,4% to 0,65% Logarithmic decrease with logarithmically increasing frequency |
| Frequency range (kHz) | Compatibility level in dB(yV) |
| 9kHz to 30kHz | 129,5 to 122 dB(yV) Linear decreasing with the logarithm of the frequency 9kHz to 30kHz |
| 30kHz to 50kHz | 122 bis 119 dB(µV) Limit value linearly decreasing with the logarithm of the frequency 30kHz to 50kHz |
| 50kHz to 150kHz | 113 bis 89 dB(µV) Limit value linearly decreasing with the logarithm of the frequency 50kHz to 150kHz |
| Voltage mV | dB (yV) |
| 1000mV | 120dB |
| 100mV | 100dB |
| 10mV | 80dB |
Almost every load leaves traces on the net or in other words: “Show me your electricity and I know more about you than you expect”.
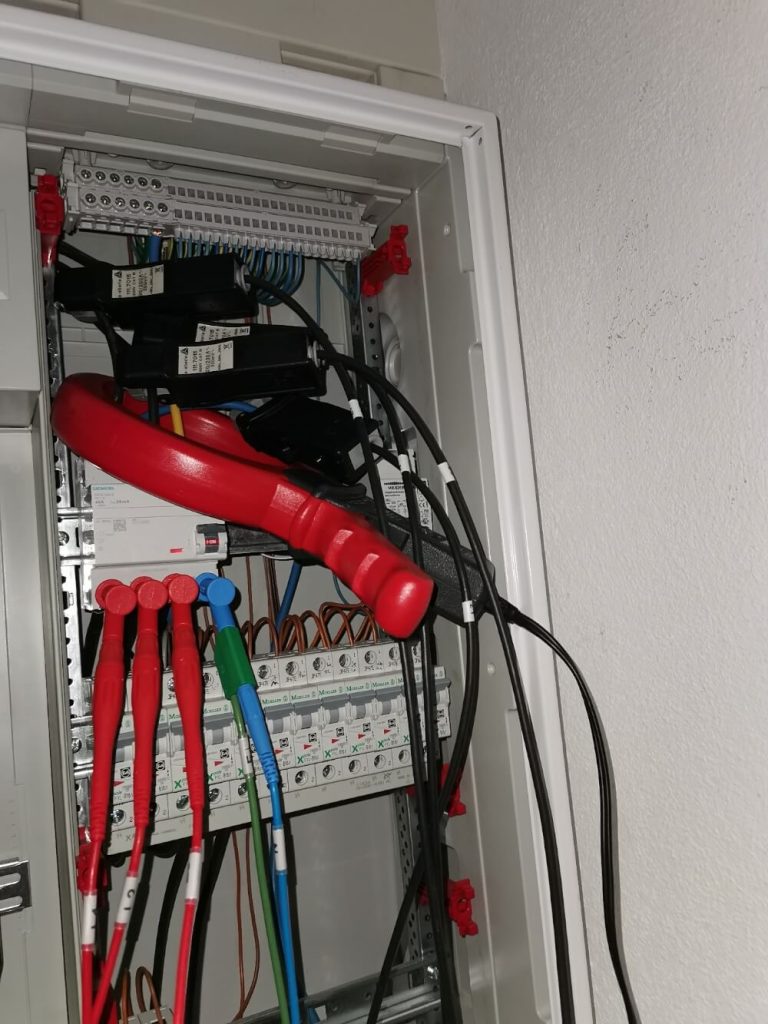
I had installed a power analyser (PQ-Box 300) in my sub-distribution in the basement and wanted to analyse the reason for a sporadic tripping of a residual current circuit breaker.
The picture shows the installation location of the measuring device PQ-Box 300 and the current clamps L1, L2, L3, N-conductor. Another large 5th current clamp additionally recorded the differential current of all currents at the connection to the RCD.
In addition to analysing the faulty device in the house that triggers my RCD, I noticed that many loads in my distribution leave their traces in the frequency spectrum. I was able to clearly identify many devices in the frequency range, although they would certainly not have been noticed in the total current of the entire house with all loads. So I could see when the washing machine was running or when my wife was using the hoover, which leaves a clear frequency of 8 kHz in the spectrum.
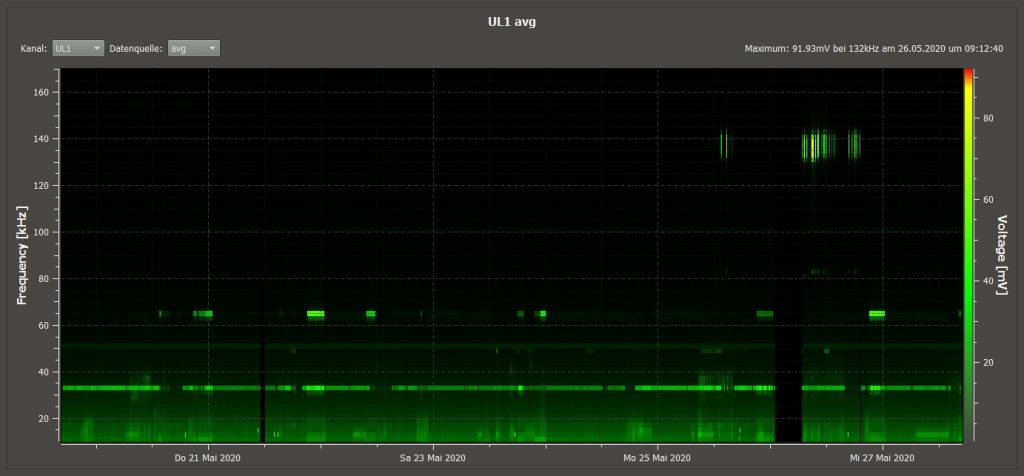
The picture shows the spectrum of all frequencies of the voltage up to 170 kHz over the period of one week in a kind of 3-D representation. The colour gradients show the level of the respective frequencies.
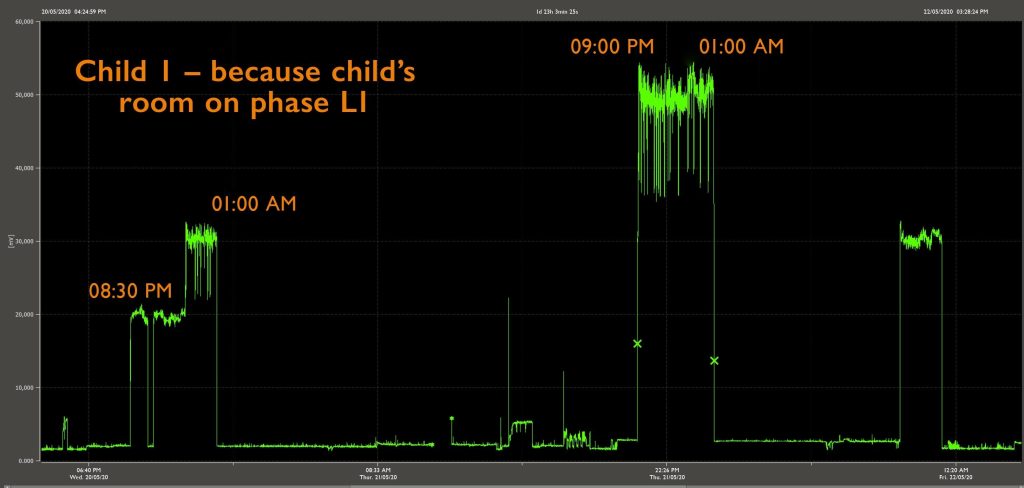
It was interesting for me that even very small loads like one of the children’s Playsations 4 could clearly be found in the frequency spectrum at 64kHz, although I had measured two floors away. Thus, I was able to monitor the child’s requirement to play only for a maximum of one hour a day, even if I was not at home.
The picture shows the 64kHz frequency on the voltage phase L1 in the distribution. Since the children’s room 1 is also connected to phase L1, these are the times when our teenager gambles. But he doesn’t let us tell him what to do.
The different level heights are due to other loads that are currently switched on and their compensation effect. Since many other devices in the house are switched on at 8:30 p.m., for example, they absorb some of the energy of the 64 kHz frequency and thus reduce the interference level that I can measure in the distribution. At 1 a.m., only a few loads are still active, here the levels have a stronger effect and can be measured with increased values in the distribution in the basement.
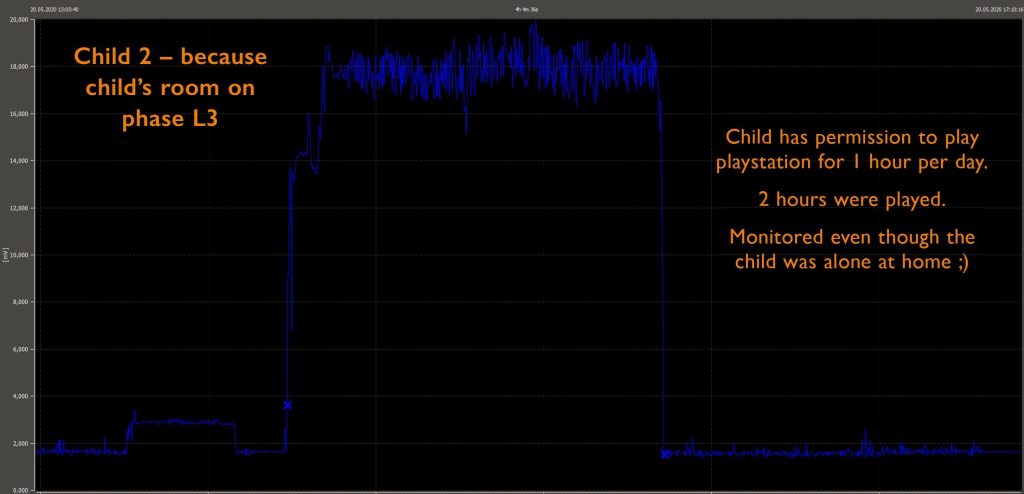
The 12-year-old has a time limit of 1 hour and this was clearly exceeded in this case with 2 hours.
The picture shows the 64 kHz frequency on the voltage of phase L3 in the distribution. This phase also supplies the second children’s room and can therefore be clearly assigned to the younger son.
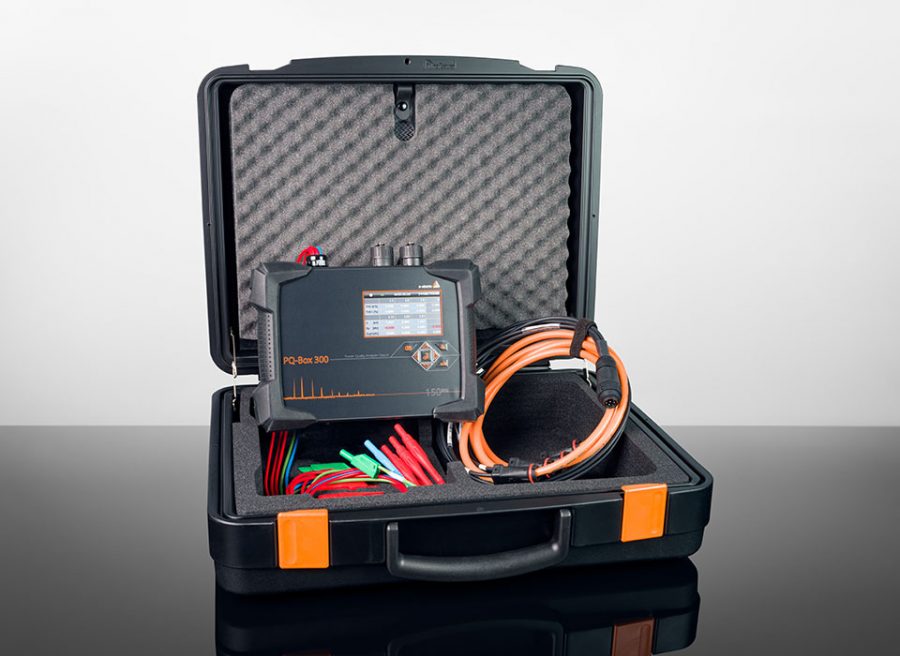
The PQ-Box 300 power quality analyser uses 24-bit analogue-digital input converters and a sampling rate of 409.6 kHz. Due to the extremely high resolution, even the smallest interference levels of a few millivolts can be measured and assigned very precisely. The measurement range for super harmonics covers frequencies up to 170 kHz. These can be permanently recorded without gaps over a long measurement period. For the problems described above, it is rarely possible to detect the cause via a short online measurement. As a rule, all measurement data should be recorded without restriction for at least one week in order to later be able to clearly assign the time of the disturbance and also the cause by correlating the various measurement values.
Conclusion
Network feedback in the frequency range between 2kHz and 150kHz has been steadily increasing in our energy networks for several years and this trend will continue, also strongly driven by the energy transition. On the other hand, we are controlling more and more devices and systems with small signals. Mutual interference cannot be ruled out. Today, the rules of the game for the public grid are laid down in the EMC standard IEC61000-2-2, which regulates with its limit values up to 150 kHz whether a load introduces too high interference levels into the grid at the connection, or whether a disturbed device has too low interference immunity. Measurement technology can prove this. If the interference level is still below the limit values and a load is negatively influenced, the interference immunity is probably designed too low here. If the limit value of the standard is exceeded, it is almost certain that the source of the interference is providing too much feedback into the network.
The PQ-Box 300 power quality network analyser used employs 24-bit analogue-digital input converters and a sampling rate of 409.6 kHz. Due to the extremely high resolution, even the smallest interference levels of a few millivolts can be measured and assigned very precisely. The measurement range for super harmonics covers frequencies up to 170 kHz. These can be permanently recorded without gaps over a long measurement period. For the problems described above, it is rarely possible to detect the cause via a short online measurement. As a rule, all measurement data should be recorded without restriction for at least one week in order to be able to clearly assign the time of the disturbance and also the causer later by correlating the various measurement values.
Autor
Jürgen Blum, Product Manager Power Quality Mobile