WebPQ® Visualizer
Your Power Quality measurement data – at any place, at any time, with any device!
WebPQ® Visualizer
The easy way to analyze your Power Quality measurement data
The fully responsive & web-based user interface as an installable app for the evaluation of your Power Quality data in your local IT environment!
State-of-the-art web technology with:
• Grid Overview Dashboard – Detect grid faults at a glance!
• Analysis section – Get to the bottom of causes of grid disturbances individually
• Configurable REST-API – Open for data exchange in your company
• 100 % Secure! – IT-Security via full User Rights Management System!
Updates within one year are free of charge.
Service by the service department of A. Eberle GmbH & Co. KG is recommended for first-time installation!
Have more questions or start an enquiry? Just click on “Product Enquiry”.
Visualization and evaluation of your PQ measurement data and fault records!
Simple, fast, browser-based
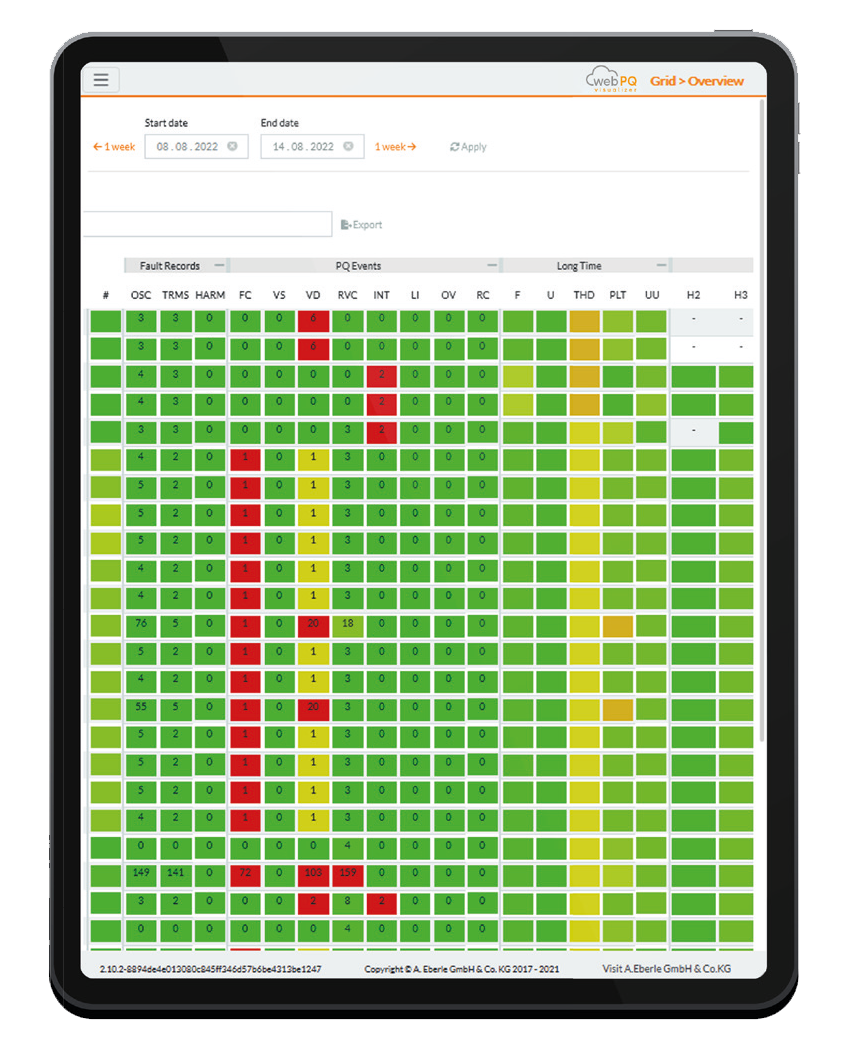
Grid Overview Dashboard
Detect faults instantly
What is the current state of the grid? Where were the last disturbances? Which measuring devices have the most power quality events?
With the intelligent WinPQ add-on WebPQVisualizer you never lose the overview:
- Interactive top down evaluation procedure
- Automatic classification of faults
- The latest fault recorder is just a mouse click away!
- Transfer and storage in individually configurable dashboards of the analysis section

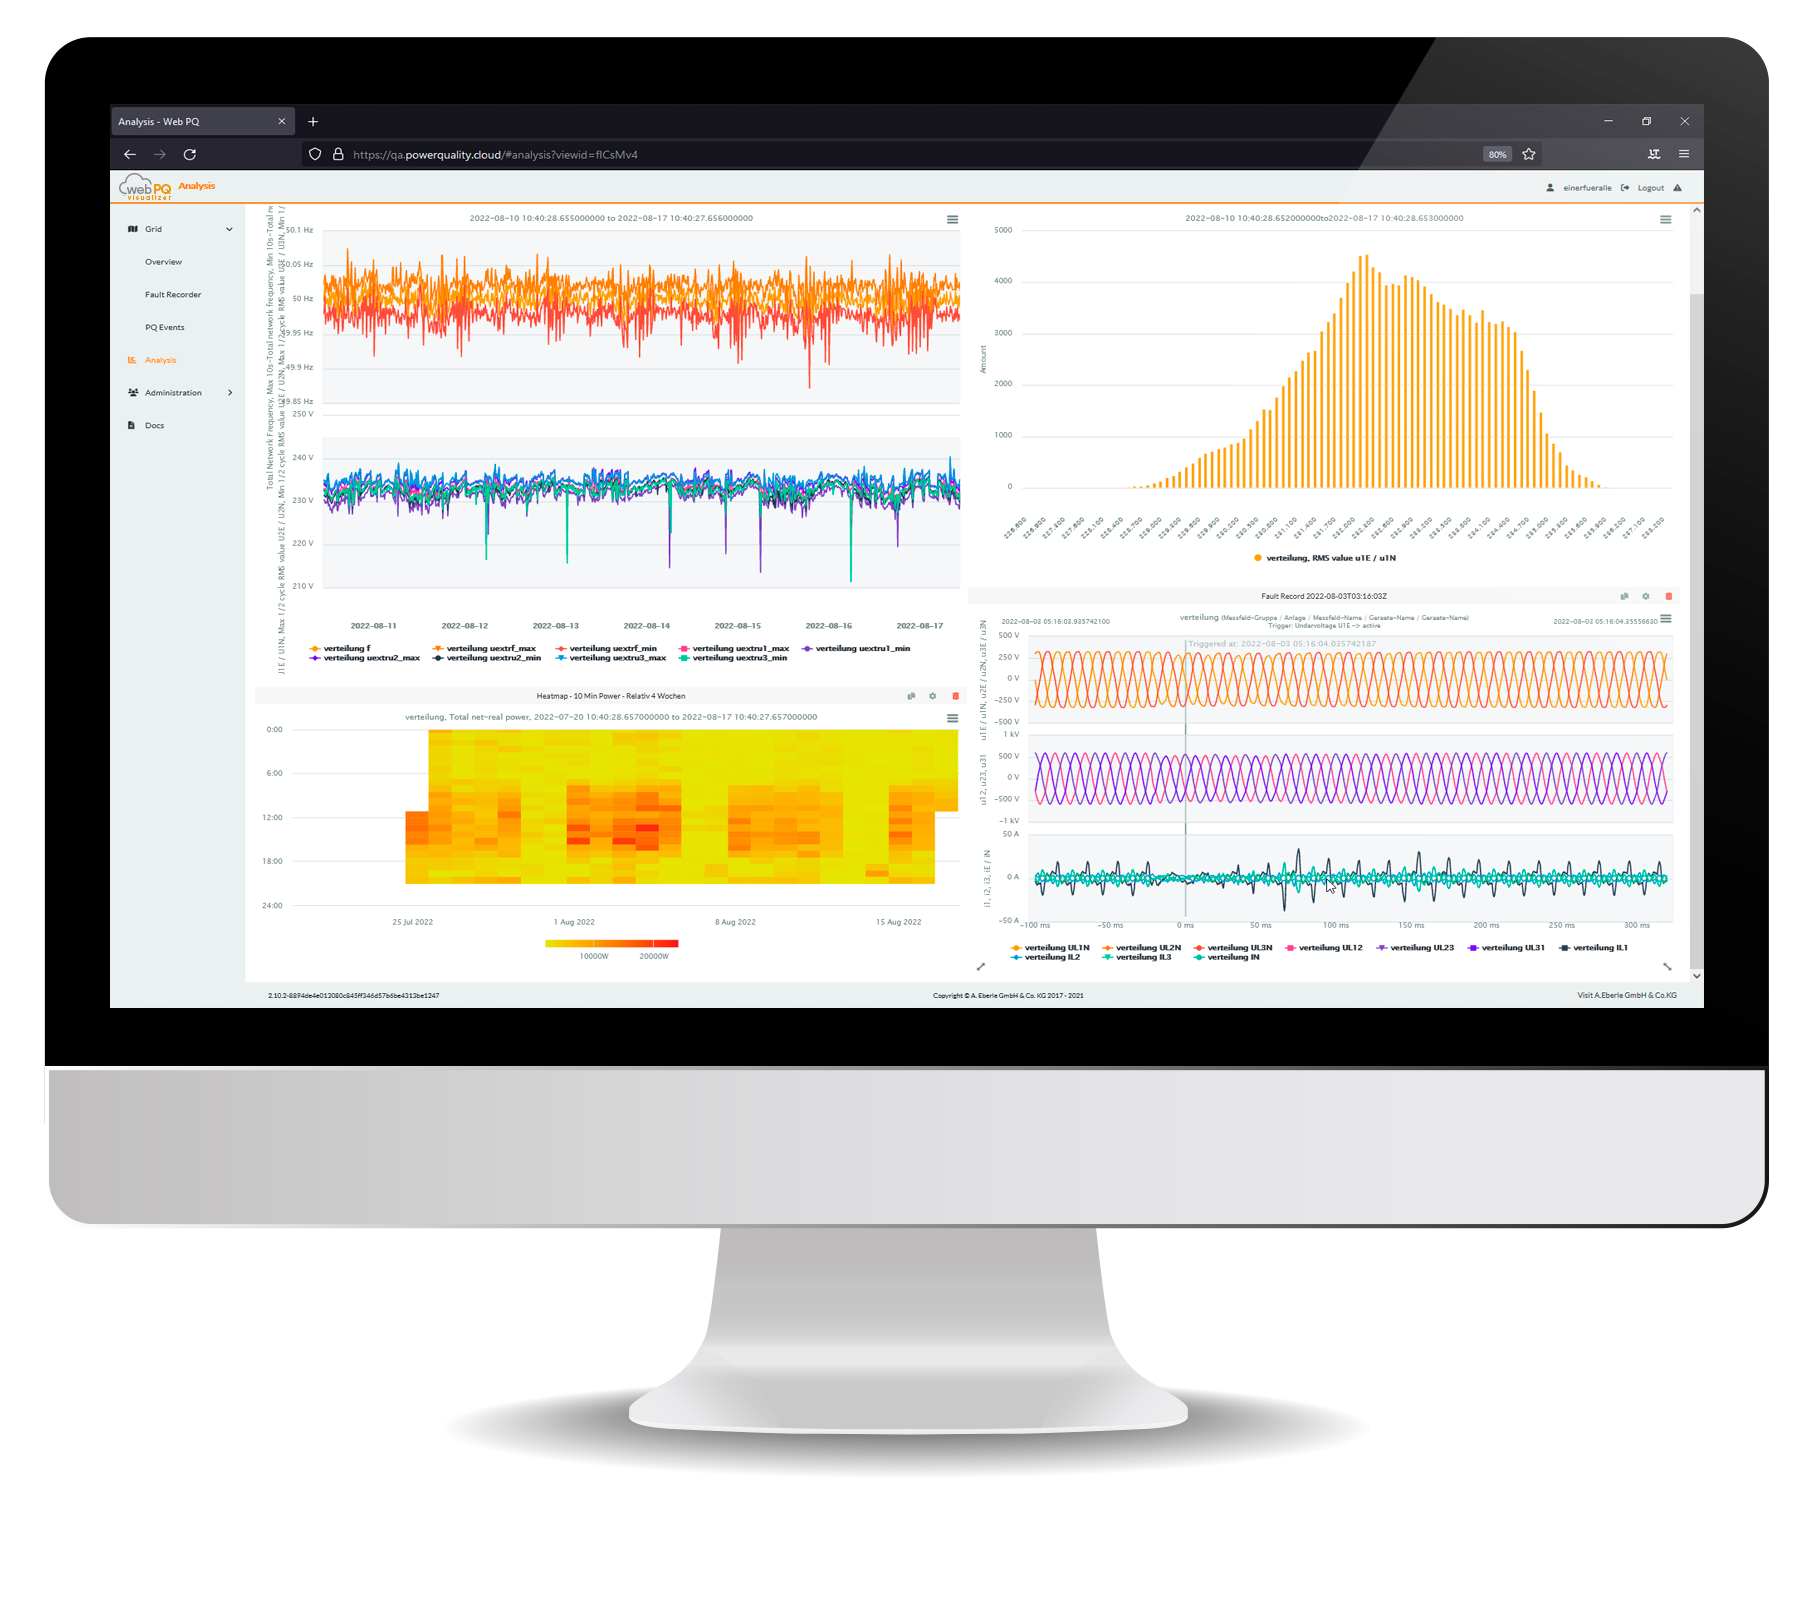
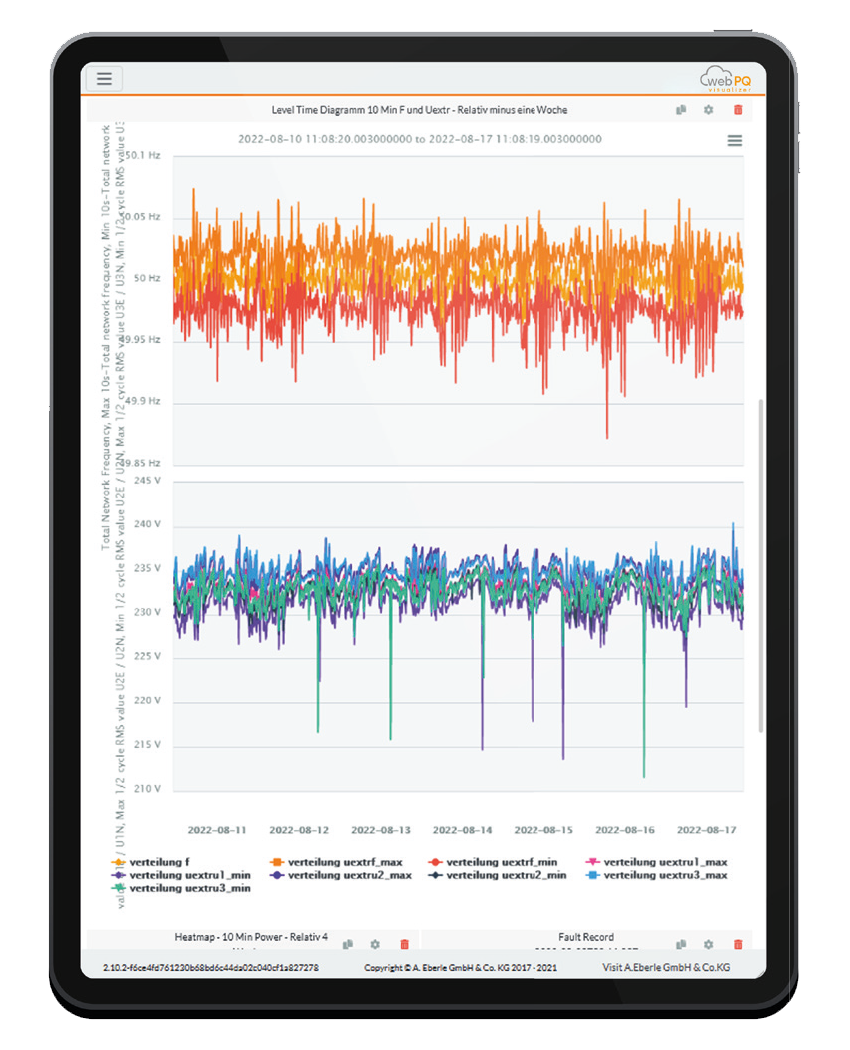
Analysis Section
Get to the bottom of causes of grid disturbances individually
Modern, freely configurable and storable dashboards for quick analysis of your power quality parameters via customizable widgets:
- Many chart types available (level time chart, ITIC, statistics, heatmap, histograms and power quality events over time)
- Free selection of devices and measured variables, such as voltage, power or even energy consumption in the widgets
- Multiple devices and time ranges per widget
- Can be saved per user and application
- Easily & quickly share your analysis in the team using „Share“ functions
Device View
Get a quick overview of an individual measuring point
Preconfigured analysis on a weekly basis of the most important power quality parameters at a glance!
- Disturbances and PQ events classified by duration and depth using interactive ITIC curve
- Voltage extremes, THD and flicker as level time diagrams
- List of all disturbance recorders with indication of duration and depth
- Frequency as an interactive histogram dashboard

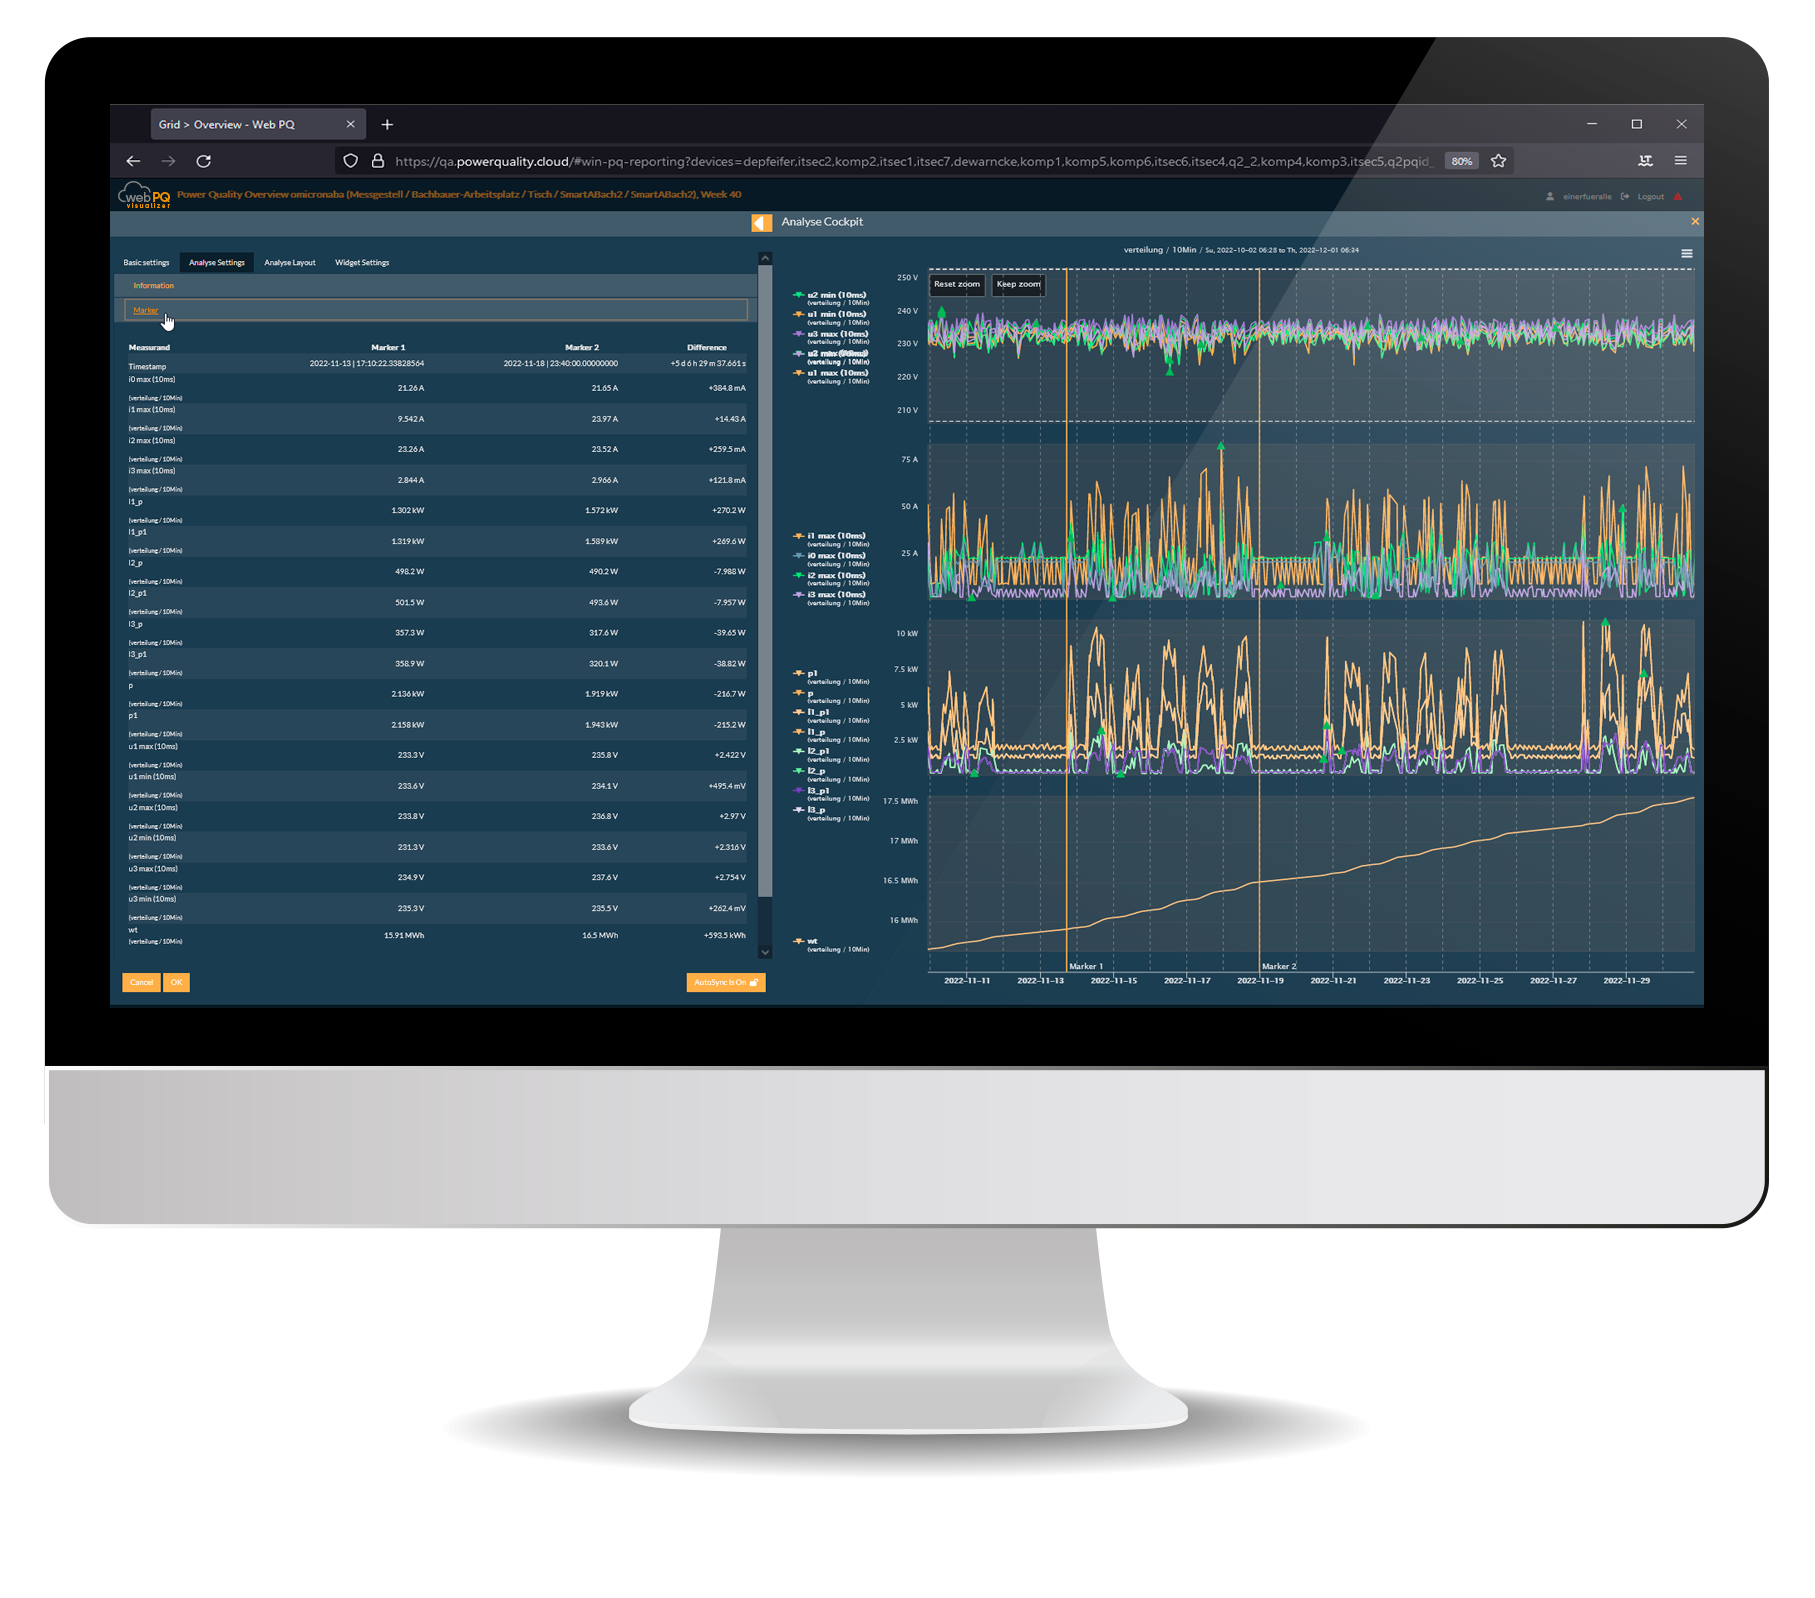
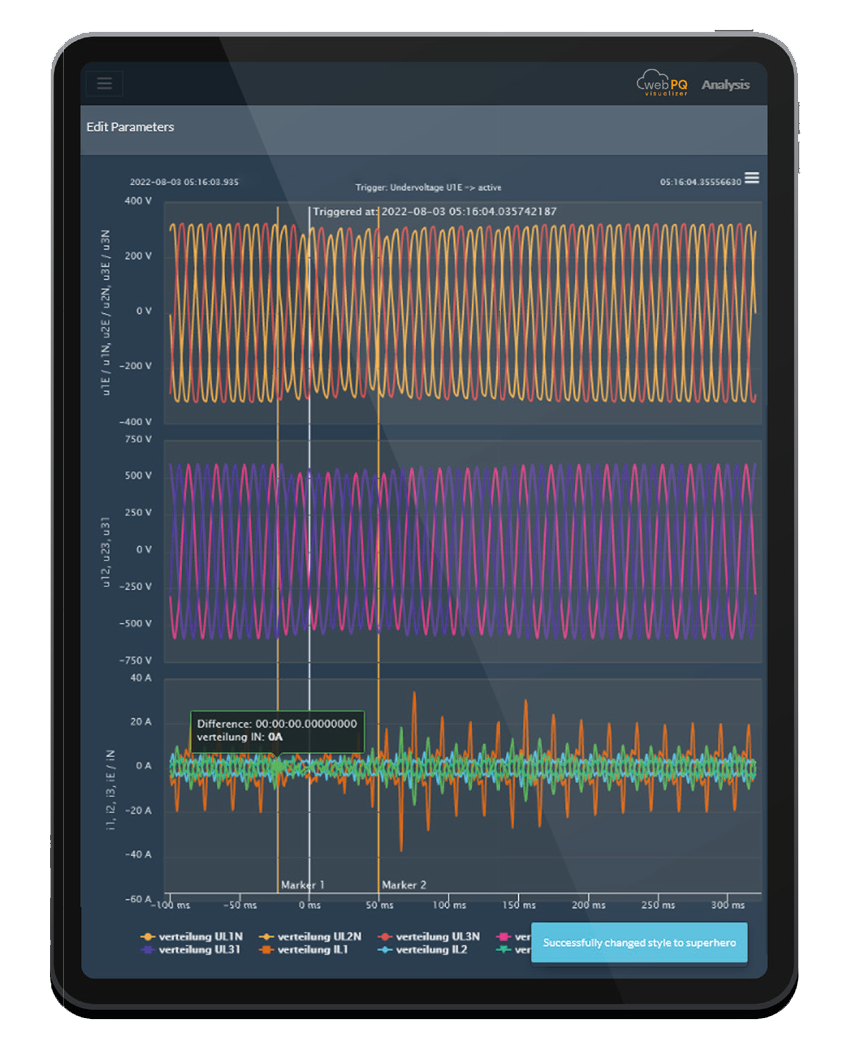
Analysis Cockpit
The tool for those who want to take a deeper look
Measure faults using markers, superimpose faults from different measuring points and classify the faults individually with your input on cause and effects.
In addition, you can measure mean and extreme values as well as trends and limit values and, for example, energy consumption.
The Analysis Cockpit helps you to quickly and safely combine data for your individual analysis and save them for your individual dashboard in the Analysis Section!
Configurable REST-API
Open for data exchange in your company
We know how necessary it is that your data can be passed on transparently via standard interfaces to third-party software such as grid calculation tools or other applications easily and fully.
For this purpose, the software offers a fully documented REST-API via Swagger.

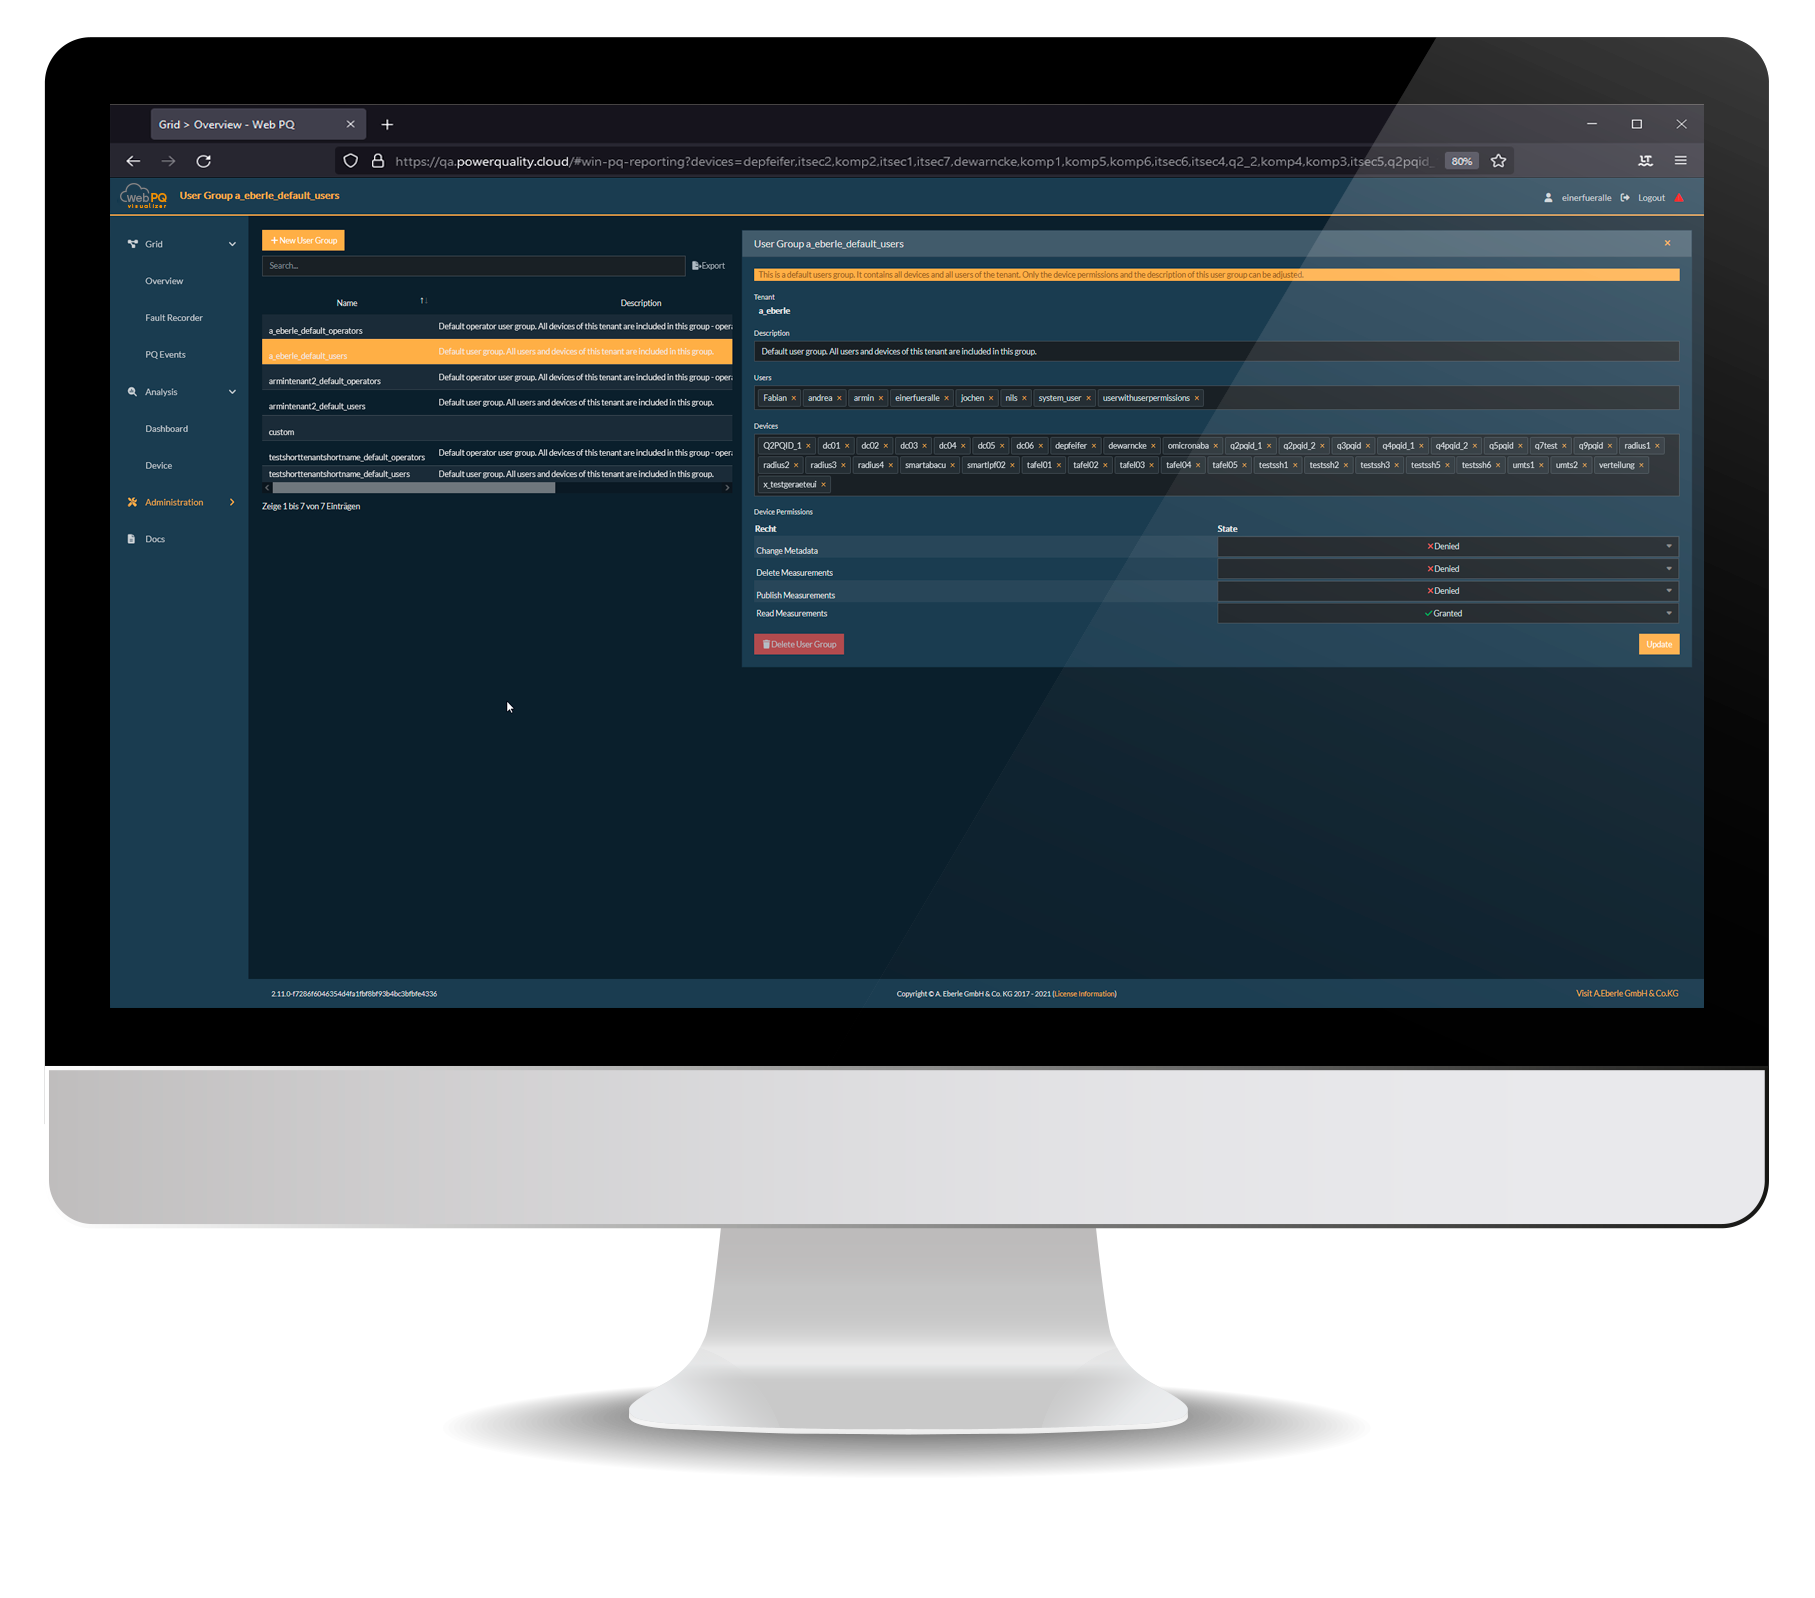
100 % Secure!
IT-Security via full User Rights Management System
Use of highly secure interfaces (HTTPS) and own certificate management with full User Rights Management System (URM).
Assign read or write rights for devices or even groups of
devices simply, securely and quickly via a central user
administration!
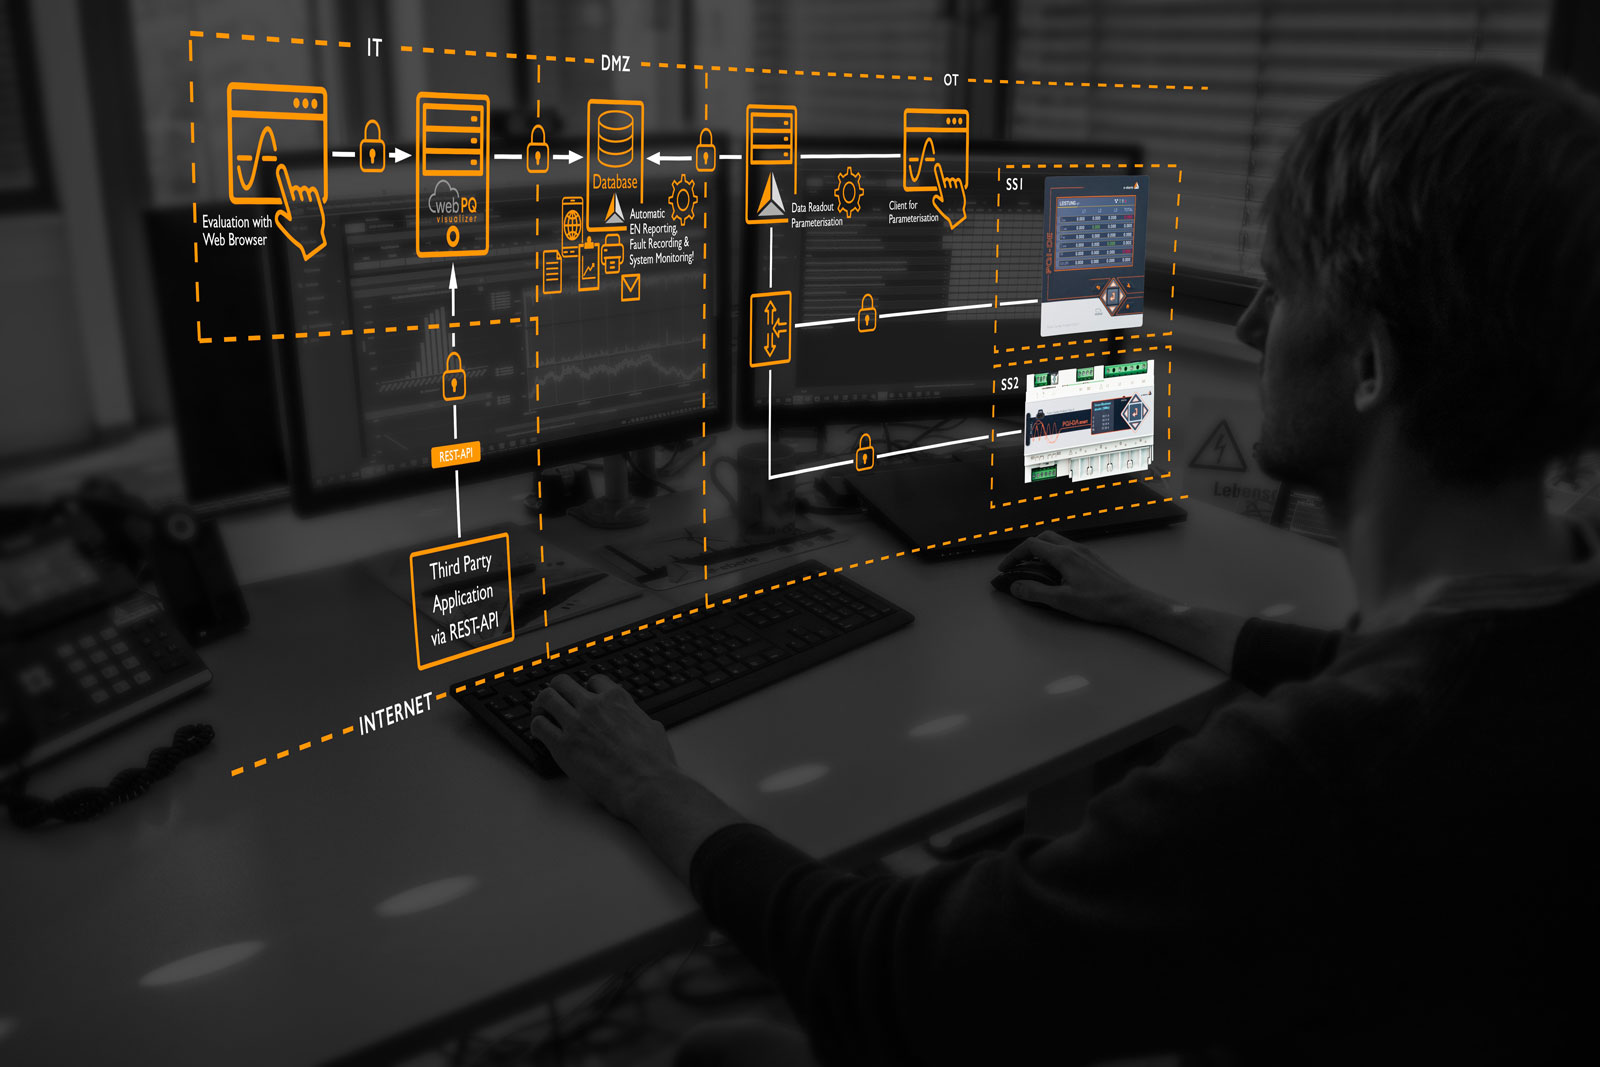
Secure system integration
Platform independent and certified
The scalable system with full client server functionality in combination with defined highly secure interfaces provides for very high flexibility in the integration into your local network!
The WebPQVisualizer extends the WinPQ with a platform independent solution, which can be installed locally in your company network (OT or also in IT).
The graphic shows an exemplary system design that has been certified several times.
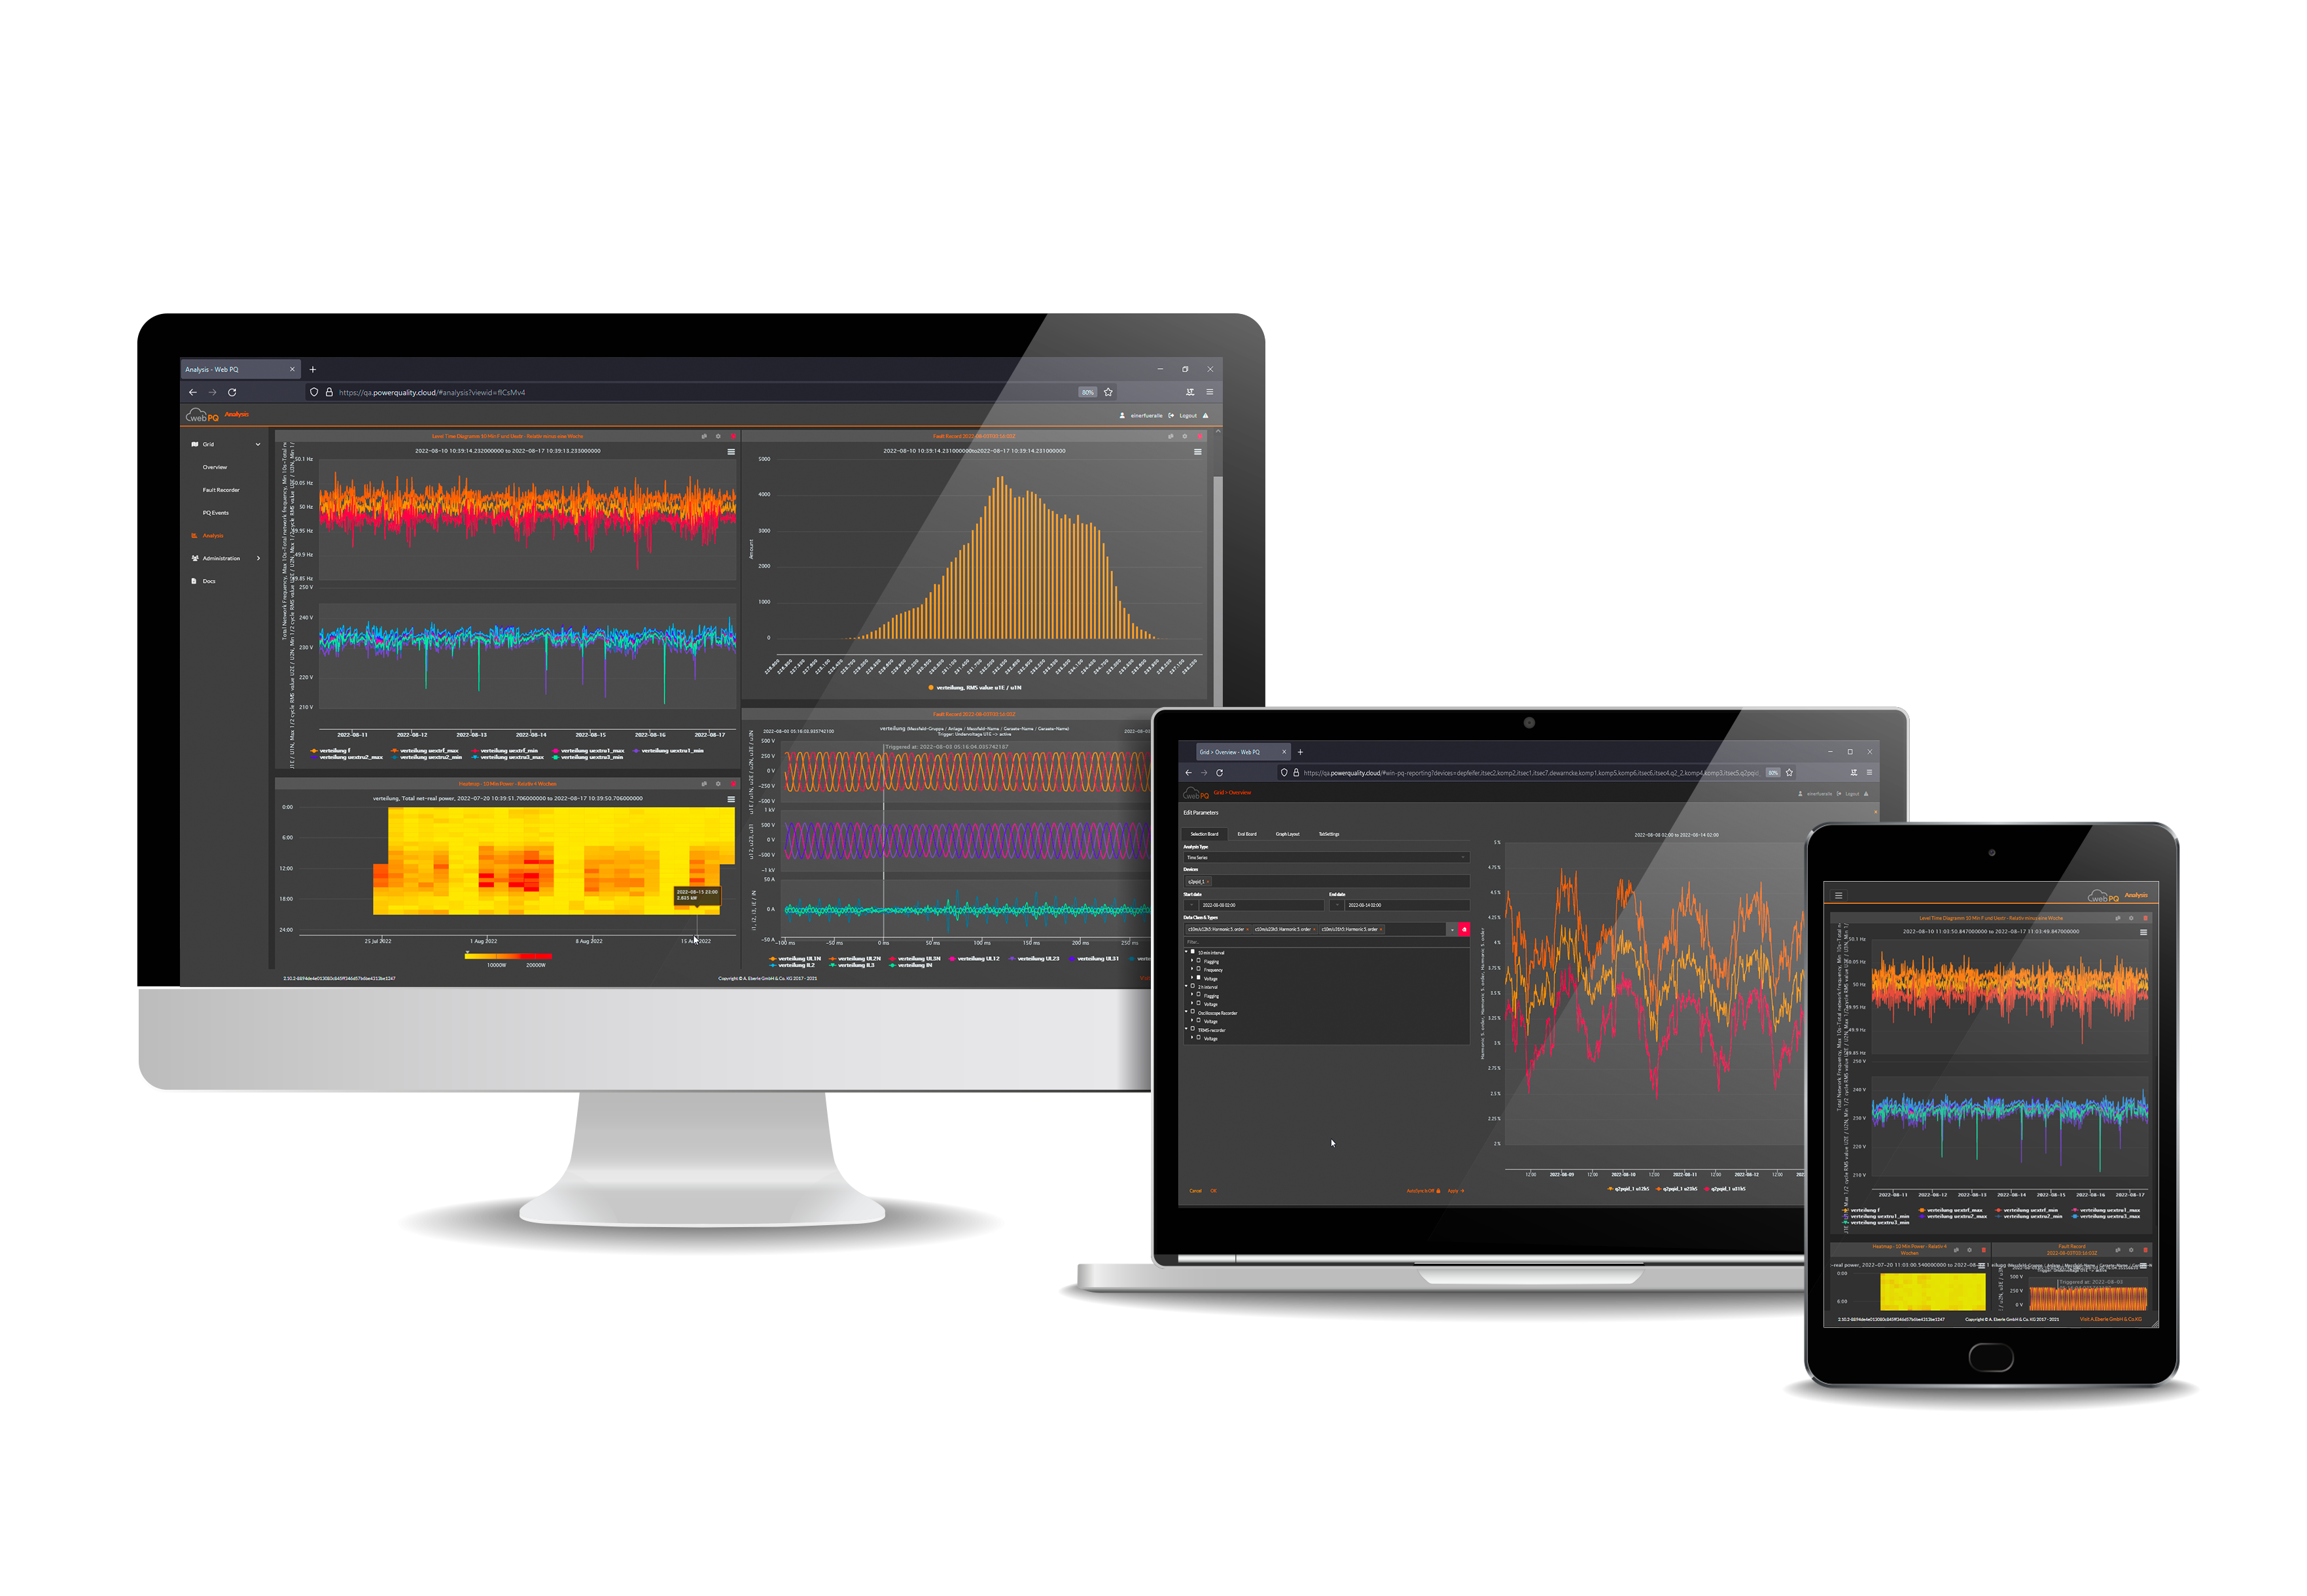
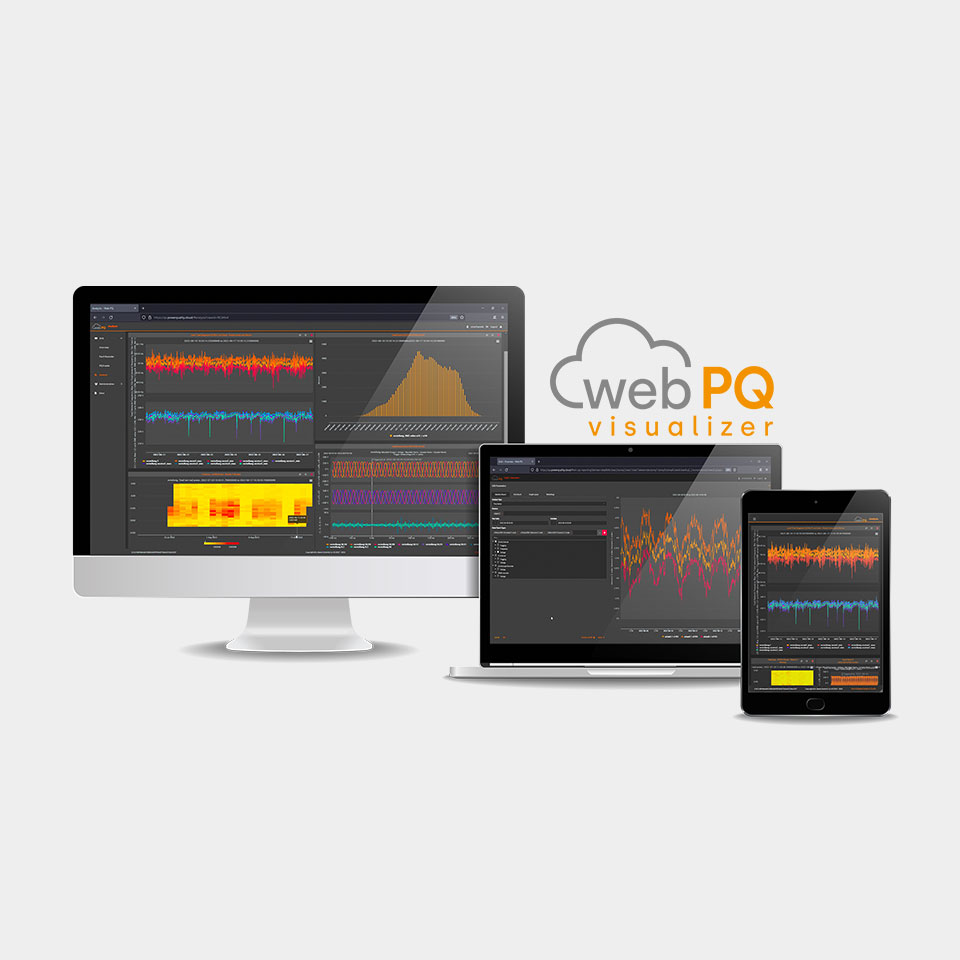
Everything at a glance, on any end device
Responsive view of WebPQ® Visualizer
System requirements
• WinPQ version higher than version 6.4 with PostgreSQL, MS SQL, MySQL (v5)
• Supported browsers: Microsoft Edge, Mozilla Firefox or Google Chrome, Safari.
WebPQ® Visualizer – The intelligent add-on to WinPQ

WinPQ
High-quality analysis software
The WinPQ system solution for all built-in A. Eberle fault recorders, power quality monitoring devices and mobile network analyzers. Monitor power quality permanently – from the high-voltage grid to the end user in a system. Intuitive operation despite the vast amount of data handled.