This second technical report on the subject of reactive power and in particular the distortion reactive power supplements the first contribution No. 05 (cosphi vs. power factor theory). In this report the voltage and current of an light bulb is measured with a power analyzer (PQ-Box 200) in an online measurement, which is controlled by a phase angle control. In the appendix of this measurement example the origin of the different types of reactive power are to be illustrated.
The example shows how to use a power analyzer to measure the voltage, current and power readings once on the mains side at the socket and once directly at the load, in this case a light bulb. With these measured values, one can then calculate and analyze the distortion reactive power.
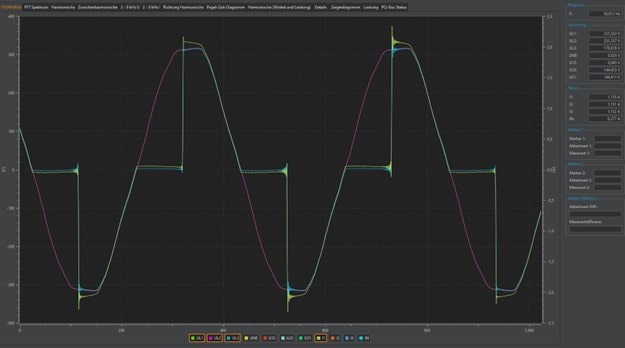
In the online oscilloscope image, the waveforms of current and voltage are visible. At first, only the
voltages are displayed. A sine wave of the socket can be seen, which has a clean shape, but is slightly
flattened. This is typical for office buildings where a large number of single-phase power supplies are used.
The line voltage has an RMS value of nearly 230V UL1. When the phase angle control is set to maximum brightness, the RMS value of the current is 1.33A
The voltage is now cut via the phase angle control until an effective current value of 1A is reached. The current is identical at every point of the circuit and is also 1A RMS at the light bulb.
The voltage at the light bulb was reduced to an RMS value of 135V. Since the light bulb is an ohmic load, the current follows the applied voltage 1:1. In the measurement results, the voltage at the socket is shown in green and the voltage given via the phase angle control of the light bulb is shown in blue.

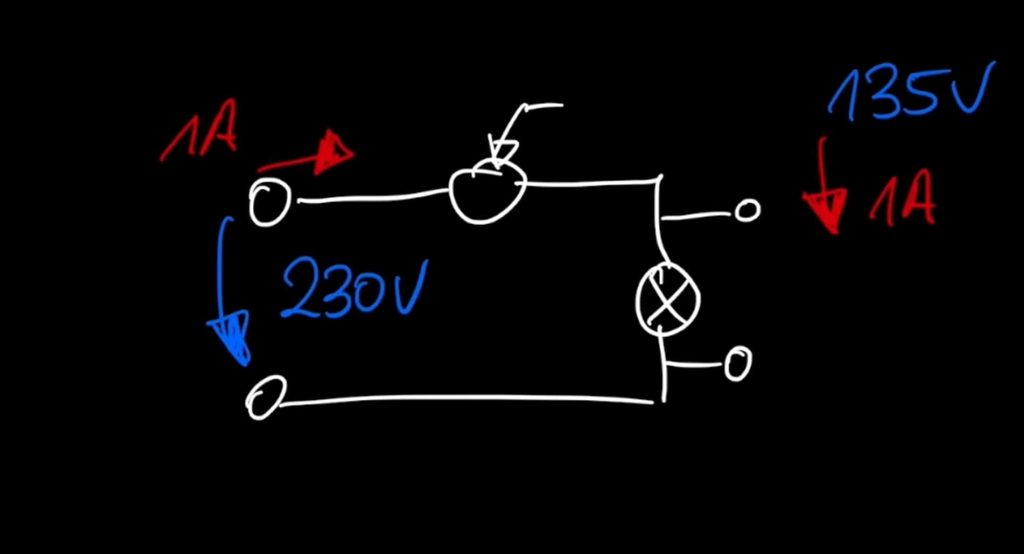
In the measurement, a voltage of 135 volts and a current of 1 ampere were measured at the light bulb. On the mains side, 230 volts and 1 ampere were measured. So the question arises which power measurement values result on the mains side as well as at the consumer? Which power is calculated as active power?
The use of phase angle control results in a shift of the fundamental oscillation voltage to the fundamental oscillation current. This gives us a phase angle phi of the fundamental shift. In this case the current is 40 degrees lagging to the voltage. The phase angle on phases L2, L3 (on the light bulb) is almost zero, which corresponds to a cosine phi of exactly 1. It should be noted that the light bulb remains an ohmic load.
Figure No. 5 shows all power measurement values of the measurement inputs of the PQ-Box 200. All measurement values of phase L1 refer to the power supply (socket), the measurement values L2 and L3 were determined directly at the light bulb.
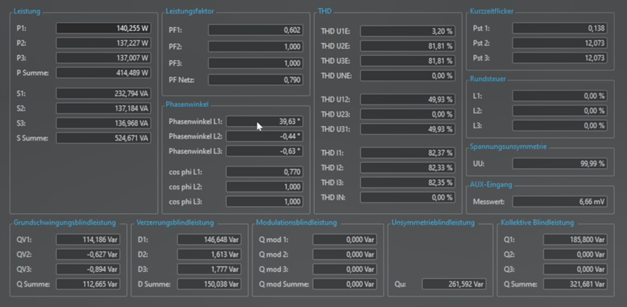
This results in the following measured power values:
- Measured values at the light bulb (L2, L3)
The active power corresponds to the apparent power. The cosphi as well as the power factor PF are at the value 1, which corresponds to a purely resistive load. - Measured values at the mains connection (before phase angle control; L1)
Due to the phase shift from fundamental current to voltage with approx. 40°, there is a fundamental
reactive power of 114Var. This reactive power alone cannot explain the difference between the
apparent power (232VA) and the active power (140W). The power factor that results from the division of the apparent and active power is 0.6. The cosphi that is calculated from the phase angle phi results in a value of 0.77.
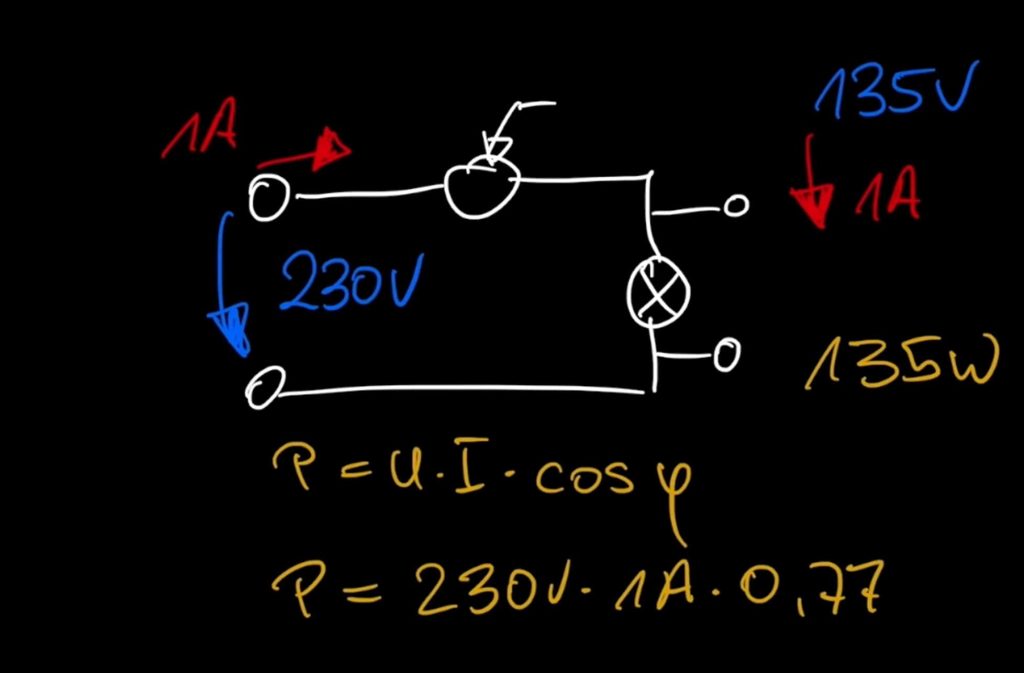
If the active power at the input of the circuit is calculated with the known formula P = U x I x Cos(Phi) the measured values will be incorrect. In our case an active power of 177W. In order for the formula to calculate a correct active power, it must be ensured that only the 50Hz section of the current is used for the electricity. This corresponds to 1A.
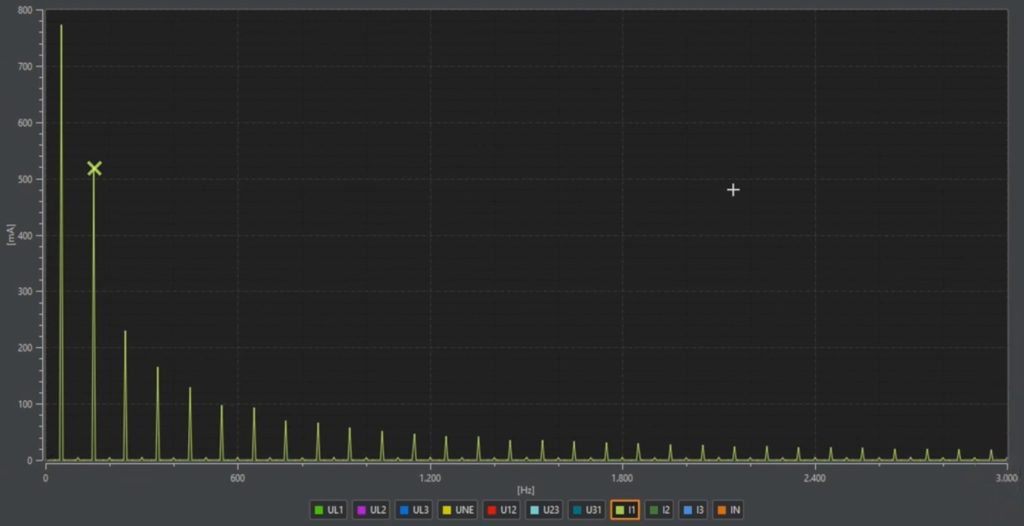
An analysis of the current spectrum shows an RMS value of 1A, which is the sum of the fundamental and all current harmonics. If the cursor is positioned on 50 Hertz, the WinPQ mobil software shows a value of 770mA and, for example, on 150 Hertz a value of 118mA. A correct calculation of the active power requires the use of 230 volts multiplied by the correct current, which is limited to the 50 hertz component of 0.770A and the cosine of the angle Phi of 0.77. The result now corresponds to the value converted by the light
bulb. The meter already calculates this correctly, resulting in an active power of 139 watts on the mains side. The light bulb currently converts 136 watts. The difference of a few watts is due to losses of the dimmer.
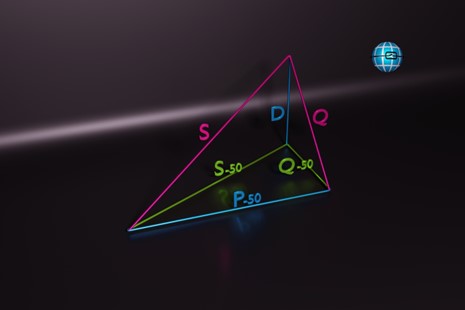
In this circuit, the harmonic reactive power is not negligible. This can be seen in graph 9 (marked D).

In this measurement, the collective total reactive power is composed of the fundamental reactive power of 114Var and a distortion reactive power (harmonic reactive power) of 147Var. These summed squarely give a collective total reactive power of 186Var. The active power is 138W. The fundamental displacement reactive power of 114Var is at right angles to the active power (green). The square sum of the two reactive powers gives the total reactive power for phase L1 (red) of 186var. The active power and total reactive power summed squared gives 232VA (blue), which again corresponds to U times I. It must be noted that in electrical installations, if the current is not sinusoidal, there is a distortion reactive power and this must be included in the calculation of the powers.
Author
Jürgen Blum, Product Manager Power Quality Mobil