Tracking down causes of harmonics in the energy grid in practice
Today, there are hardly any consumers that draw a purely sinusoidal current from the energy grid. As soon as a system draws a current that is not sinusoidal, current harmonics are present in addition to the fundamental oscillation. These current harmonics generate corresponding voltage drops and thus voltage harmonics via the grid impedance in the grid. If the levels of the voltage harmonics rise above the permitted compatibility levels of the applicable power quality standards, the user would like a power quality network analyser to provide information about the cause of these frequencies.
Furthermore, there is a desire for information as to whether a corresponding harmonic is fed into the network by the customer or whether the consumer receives this harmonic from the network. An angle determination of harmonics is also needed for a variety of applications, such as the design of active or passive harmonic filters, connection conditions of harmonic generating systems or an evaluation of harmonic problems in a network section.
In this technical paper, the physical relationships are to be explained using real examples. The various evaluation options and their differences will also be explained in more detail. Today, different manufacturers of power quality measuring devices use different calculation methods, which are not comparable with each other.
Fundamentals Power flow of harmonics
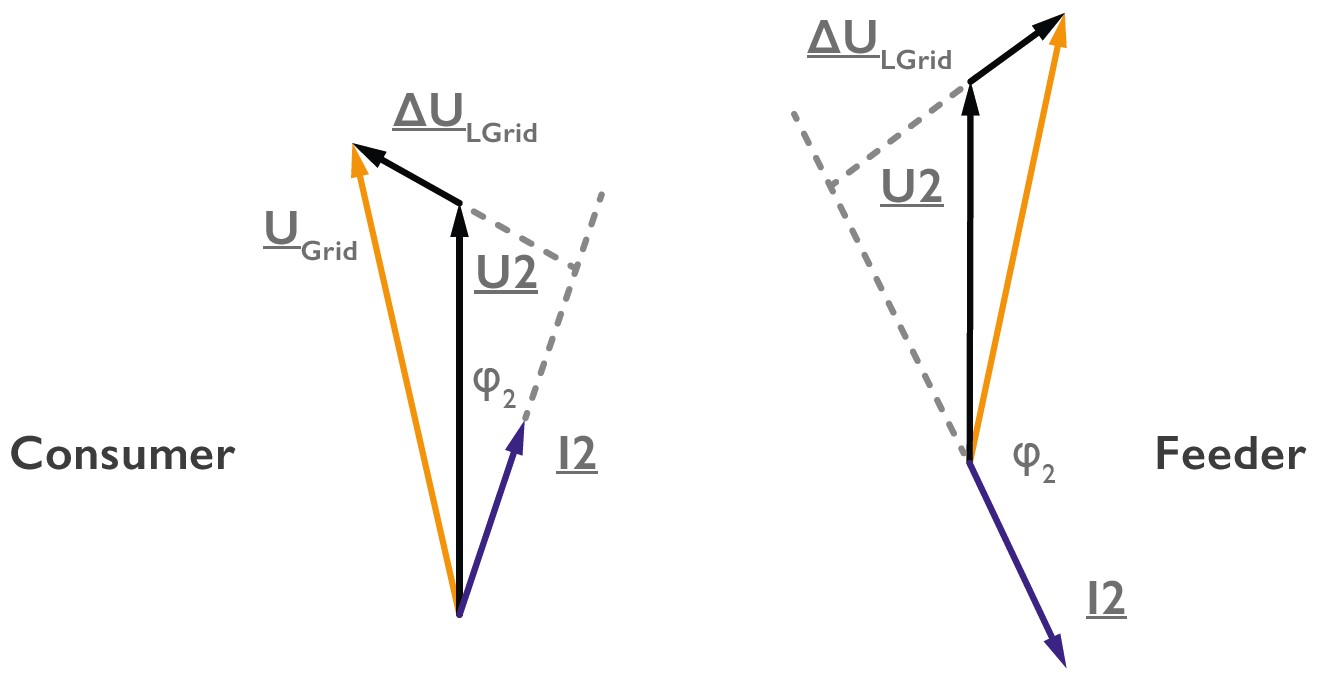
The power flow direction of harmonics is determined by the sign in the active power. Figure no. 1 shows the single-phase equivalent circuit diagram of a grid or consumer arrangement. These figures show the associated vector diagrams for two power flow directions. One is the supply and the other is the regeneration of power.
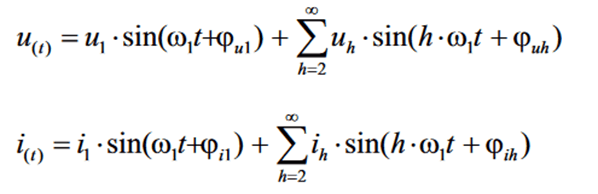
The active power is calculated for pure sinusoidal variables according to:
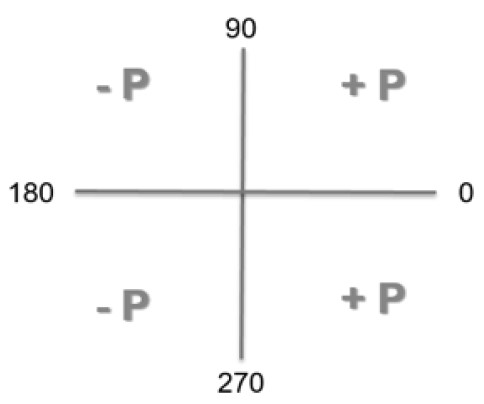
P_{2} = U_{2} * I_{2} * cosϕ_{2}The formula for calculating the active power can thus be easily calculated for all frequencies. The sign of the active power is determined solely by the phase angle ϕ. In a 50 Hz alternating current network, current and voltage change direction 100 times per second and thus cannot have a sign.
In the angular range 0 ≤ ϕ ≤ 90° and 270° ≤ ϕ ≤ 0° there is a consumer structure and P has a positive sign.
For 90° ≤ ϕ ≤ 270° P is calculated with a negative sign, so power is fed in by definition.
Example 1: Harmonic generator in a clean network
The consumer is connected here in a pure sinusoidal network without harmonics. The Fourier transformation in a power quality network analyser provides both the amplitude and the angle of the respective harmonic at the measuring points. If the angular difference between current and voltage of the same frequency is 90° ≤ ϕ ≤ 270° the consumer acts as a generator at this harmonic. By definition, it feeds this harmonic into the grid. (thus contaminates the grid)
Sinusoidal mains voltage with current subject to harmonics
From the definition of the active power, the active power results accordingly with a current subject to harmonics:
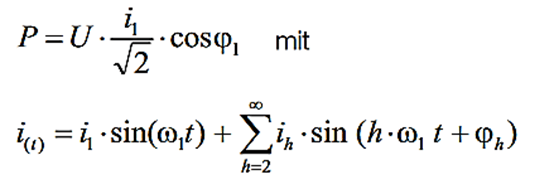
This shows that only the fundamental current oscillation i1(t) determines the active power.
Example 2: Current and voltage are subject to harmonics (real example as usual in practice)
Since every current harmonic causes a corresponding voltage harmonic via the impedance of all network components such as transformers and lines, this is the standard case in network analysis. In this case, the voltage consists of fundamental and harmonics analogous to the current.
With the approach of non-sinusoidal current load and voltage, the power calculation becomes much more complex.
Attention: Only voltage harmonics and current harmonics of the same frequency together result in active power!
Example 3: Harmonic generator in a network already polluted with harmonics
If a consumer is connected in an industrial network, parallel networks as well as neighbouring consumers also generate harmonics. The harmonic voltage of the individual harmonics results from a superposition of the individual components. This influences both the amplitude and the angle of the harmonic voltage vector. The now measured harmonic power and thus the resulting direction of the harmonics is strongly influenced by neighbouring networks and consumers. Often more strongly than by the measured consumer itself. The result of this measurement is very unreliable in many cases
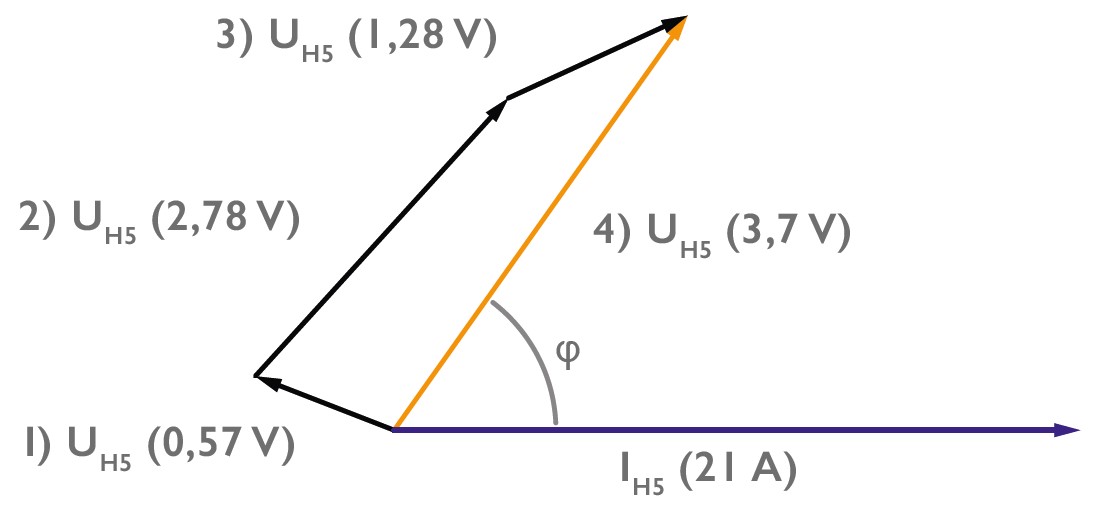
Figure 3 is intended to show the vectorial addition of the grid reaction of various interference sources.
The system current of an industrial system IH5 (red) with its 21A generates the voltage drop “1) UH5” with 0.57V at a mains impedance. The 5th voltage harmonic, which is already present in the upstream network “2) UH5” with 2.78V, as well as the voltage drop of the consumer currents of an office building in the same low-voltage network “3) UH5” with 1.28V are added to this value vectorially.
The resulting voltage drop of the vectorial addition at the measuring point is marked green in the example “4) UH5” with 3.7V and is usually a lot smaller than the absolute addition of the voltage drops of the different consumers.
In this case, the angle ϕ of the 5th harmonic is very strongly influenced by the other loads or the already existing preload in the network.
In this example, the angle ϕ caused by the voltage drop of the system current would be in the 2nd quadrant and would therefore result in a negative active power. However, since a network analyser can only measure the sum of all vectors at the measuring point “4) UH5”, the statement of a positive active power is obtained, since the angle ϕ was shifted to the 1st quadrant due to other influences. In the calculation of the active power of this 5th harmonic, this means a reversal of the power flow for this frequency. Thus, an energy system that supplies this 5th harmonic as power to the grid (by definition a generator of this frequency) has now become a system that receives this harmonic from the grid.
Conclusion
In most cases, it is not possible to infer the cause of a harmonic frequency from its power flow direction. This only works in extremely exceptional cases. That is, only if the power grid has almost no voltage harmonics and the consumer to which the power analyser is connected and which generates the current harmonics has the dominant power in this grid. All other consumers may hardly generate any voltage harmonics here via their harmonic currents. Furthermore, no voltage harmonics may already be imported from the upstream medium-voltage grid.
Angle determination of harmonics in relation to a reference phasor.
There is an alternative evaluation method in the angle determination of harmonics.
Since the active power flow direction of harmonics often does not provide any information about the originator of these frequencies in practice and every consumer that does not draw sinusoidal current from the grid today is to be seen per se as a harmonic source, the question is rather how these many sources add up in the grid at their connection point. Will they add up favourably for the grid (cancel each other out) or unfavourably vectorially? Figure 4 shows, as an example, the angle of the current harmonics of the 5th ordinal number in relation to the fundamental oscillation of the voltage U1 (50Hz). Most electronic consumers cause current harmonics in the network. However, the phase position of the different devices can lie in different squares, so that these current harmonics can also compensate each other in a case that is most favourable for the energy grid.
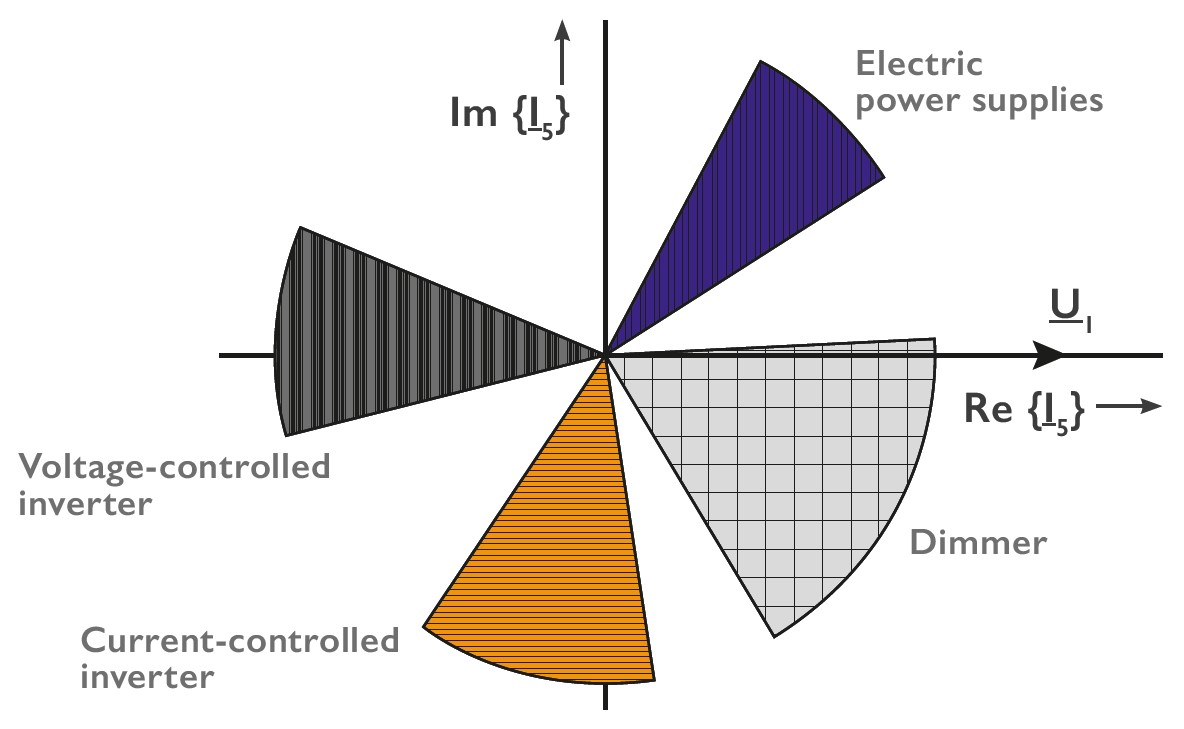
In figure 4 you can see that the angle of the 5th current harmonic of most switching power supplies in the 1st quadrant are in a narrow angular range. This means, for example, that all single-phase loads operated in an office building add up almost linearly. However, if there is also a 3-phase drive in this building, which is operated via a B6I bridge rectifier, the 5th current harmonic at the connection point of both loads will be able to compensate each other. Thus, although there are two clear harmonic generators operating in this low-voltage network, both together generate much lower interference levels on the voltage than each individually.
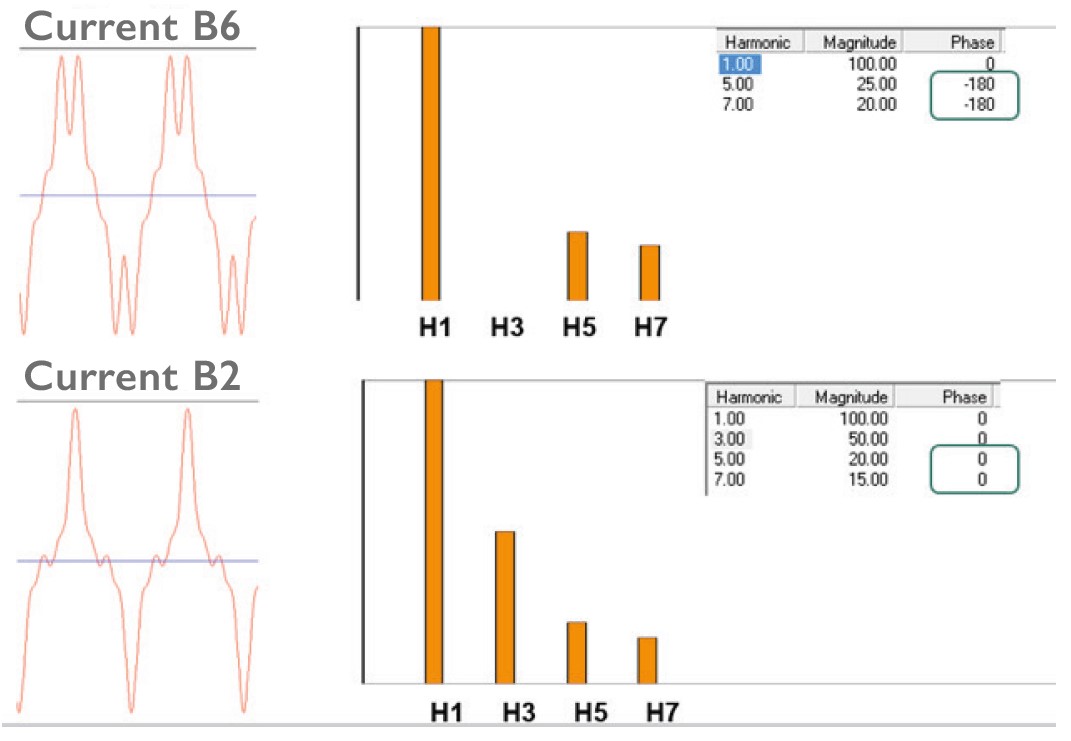
The angular position of the harmonics is the measure for the position of these frequencies and has an influence on the curve shape. In this simulation “Figure 5”, the current curve of a B6 bridge rectifier and of a typical switching power supply was simulated. In both cases, a 5th and a 7th current harmonic were impressed on the 50Hz current fundamental. The different phase position of the 5th and 7th harmonics is striking. These are 180° apart. In practice, this means that both consumer currents together are closer to a perfect sine than each individual current seen separately. In the office buildings of A. Eberle Nuremberg, for example, the level of the 250Hz voltage harmonic rises to values of 4.8% due to the large number of single-phase consumers such as monitors, servers, lighting, measuring equipment and many more. If a 3-phase air-conditioning system is connected in the summer months, designed as a B6 bridge rectifier without DC link choke, the level of the 5th voltage harmonic drops to values of 2%, even though the air-conditioning system in itself is a strong harmonic generator. However, in this case it acts like an active harmonic filter and thus has a very positive effect on the voltage quality.
All mobile and permanently installed power quality devices from A. Eberle calculate the angles of the current harmonics and voltage harmonics in both calculation variants presented so far.
a) Phase angle Phi of the respective ordinal number for each harmonic. From this, the active power and reactive power are determined for each frequency with sign.

b) Phase angle Phi of the respective ordinal number for each harmonic. From this, the active power and reactive power are determined for each frequency with sign.
Now how can an angular difference between two different frequencies be determined if, for example, the third harmonic rotates three times as fast in the vector diagram?
The evaluation of the phase angle of, for example, the 5th current harmonic to the fundamental of the voltage is determined in the zero crossing of the fundamental voltage. This angle determination is specified, for example, in the IEC61000-3-12 standard (limits for Harmonic currents caused by equipment and devices with an input current > 16A and ≤ 75A per conductor, intended for connection to public low-voltage-networks).
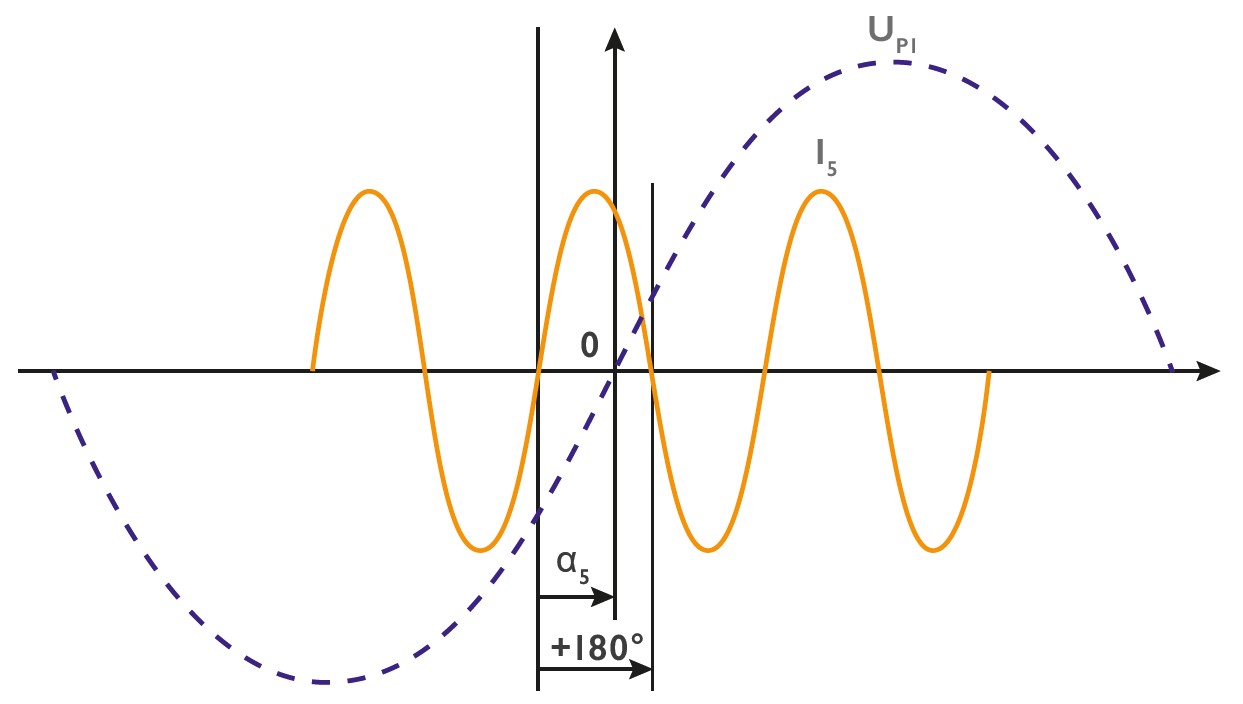
In this picture, the 5th current harmonic precedes the voltage fundamental by the phase angle a.
Calculation basis
The basis for the calculation of harmonics is defined in the standard IEC61000-4-7 (Test and measurement methods for measuring harmonics and interharmonics in power supply systems and connected devices). Here, an FFT analysis is calculated from a window over 10 mains periods (in 50Hz mains) or 12 mains periods (in 60Hz mains). This is to be determined time-synchronously in the fundamental zero crossing. A power quality network analyser according to IEC61000-4-30 class A thus continuously synchronises the sampling rate to network zero crossings. Thus the calculation window for the FFT analysis is only approx. 200ms and depends on the fluctuation of the mains frequency. From the FFT analysis, a spectrum with a resolution of 5 Hz is obtained, with magnitudes and angles of all harmonics.
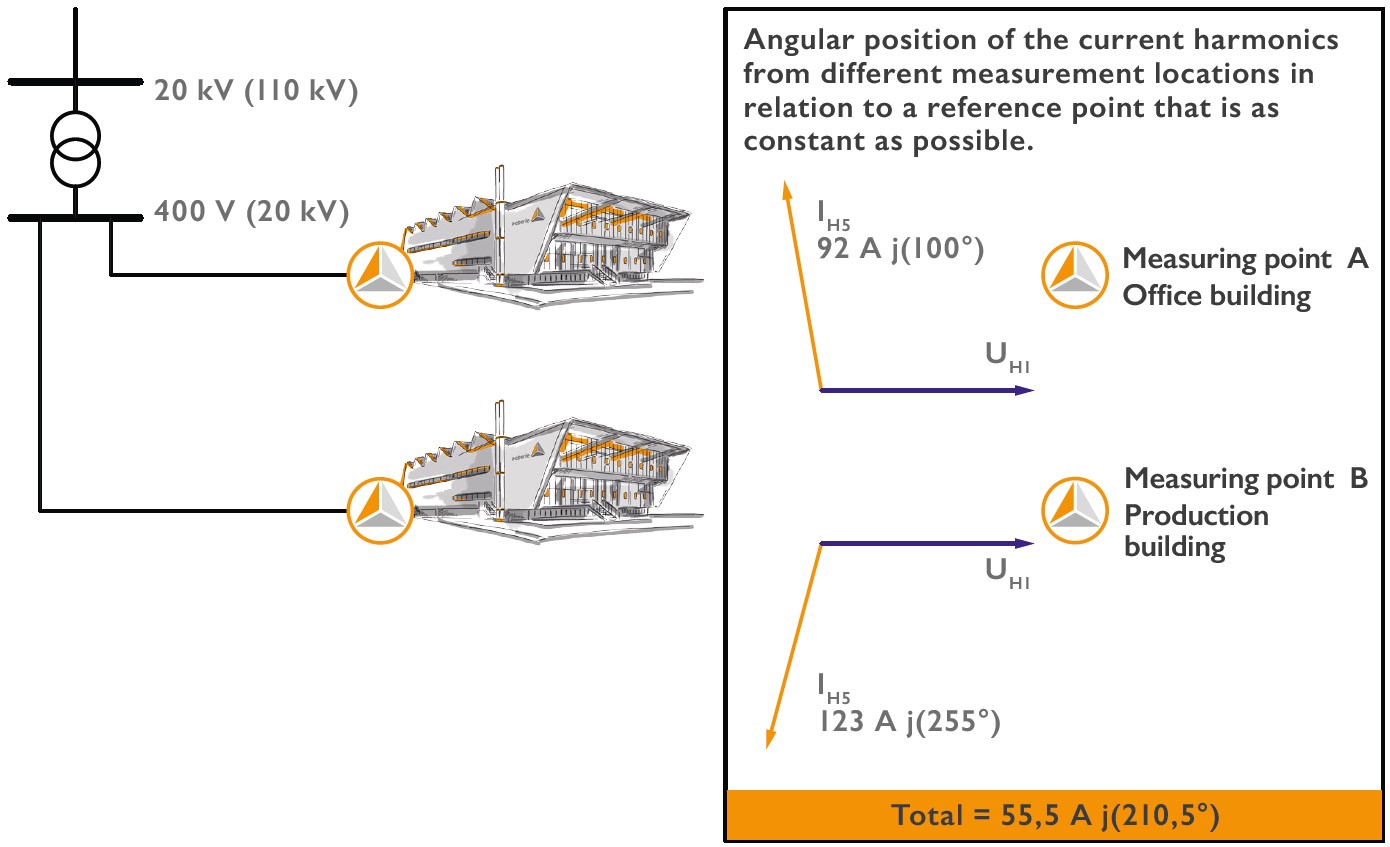
A practical example is shown in Figure 7. In an industrial park with several buildings that are supplied via a transformer, the effects of the current harmonics of the individual customer installations are to be investigated. The measured values for the 5th harmonic of phase L1 are used here as a calculation example.
Measuring point customer installation A was an office building with predominantly single-phase consumers such as PCs, monitors and lighting. A 5th harmonic current of 92 A j(100°) was measured here. Measuring point B was located at the transfer point of a production plant with predominantly frequency converter-controlled drives. Here, a 5th harmonic current value of 123A j(255°) was measured in parallel at an identical time.
If both consumer units run together, the total currents of both units of 215A do not flow at the transformer. The currents occurring at the transformer can be determined by a complex addition of the currents with magnitude and angle and in this case amount to only 55A j(210.5°).
This would be a favourable case for the grid, as the different consumer groups partially compensate each other here. Each plant, seen on its own, would load the transformer with a higher harmonic current.
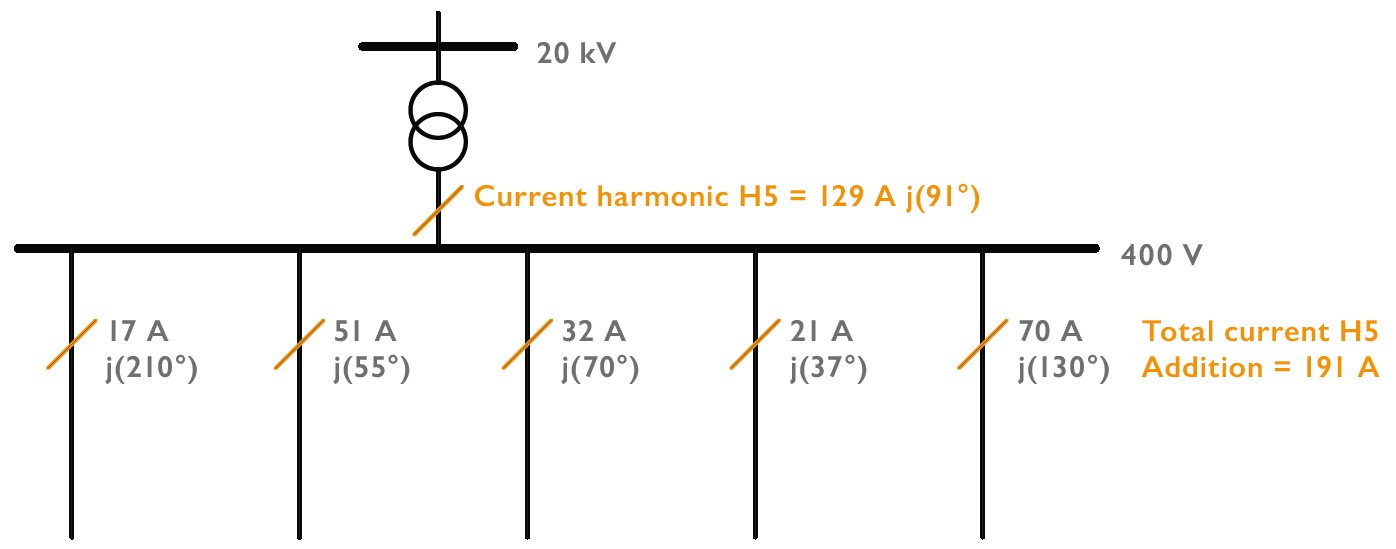
In another measurement example (Figure 8), measures were to be determined in an industrial network with very high harmonic levels on the voltage in order to reduce these levels in a sensible way.
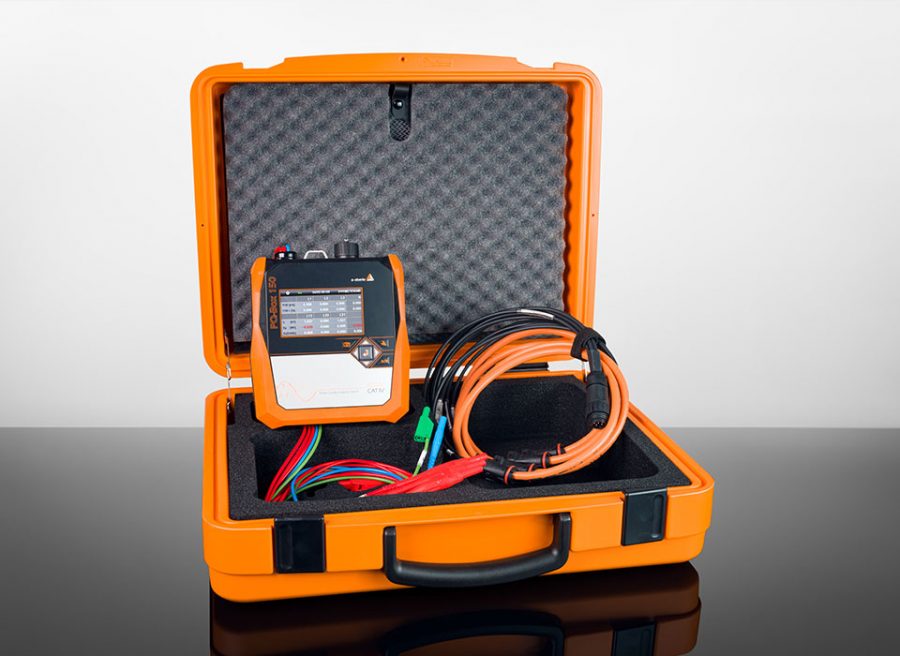
The voltage limit values of the 5th harmonic were above the limit value of 6% in this production plant and the first failures occurred in production plants. Using a PQ-Box 150, each individual cable feeder, on which different consumers were connected, was evaluated for current harmonics. The PQ-Box now outputs the magnitude and the angle for each feeder in relation to the fundamental oscillation of the voltage. If all currents of the 5th harmonic were added up linearly in this example, the result would be currents of 191A at the busbar and the transformer. Since a PQ box was also installed on the supply line to the low-voltage busbar, a value of only 129A could be measured here for the 5th current harmonic. If you now add up all the values of the cable outgoing feeders with magnitude and phase, you get exactly the value that is also measured at the transformer. Due to the very different consumers on the individual feeders, such as chargers for forklift trucks, lighting and drive technology for production, the angles lie in very different quadrants. Thus, there are loads on this low-voltage busbar that already act as active compensation of harmonic levels for the network and other loads that amplify the already high levels on the voltage.
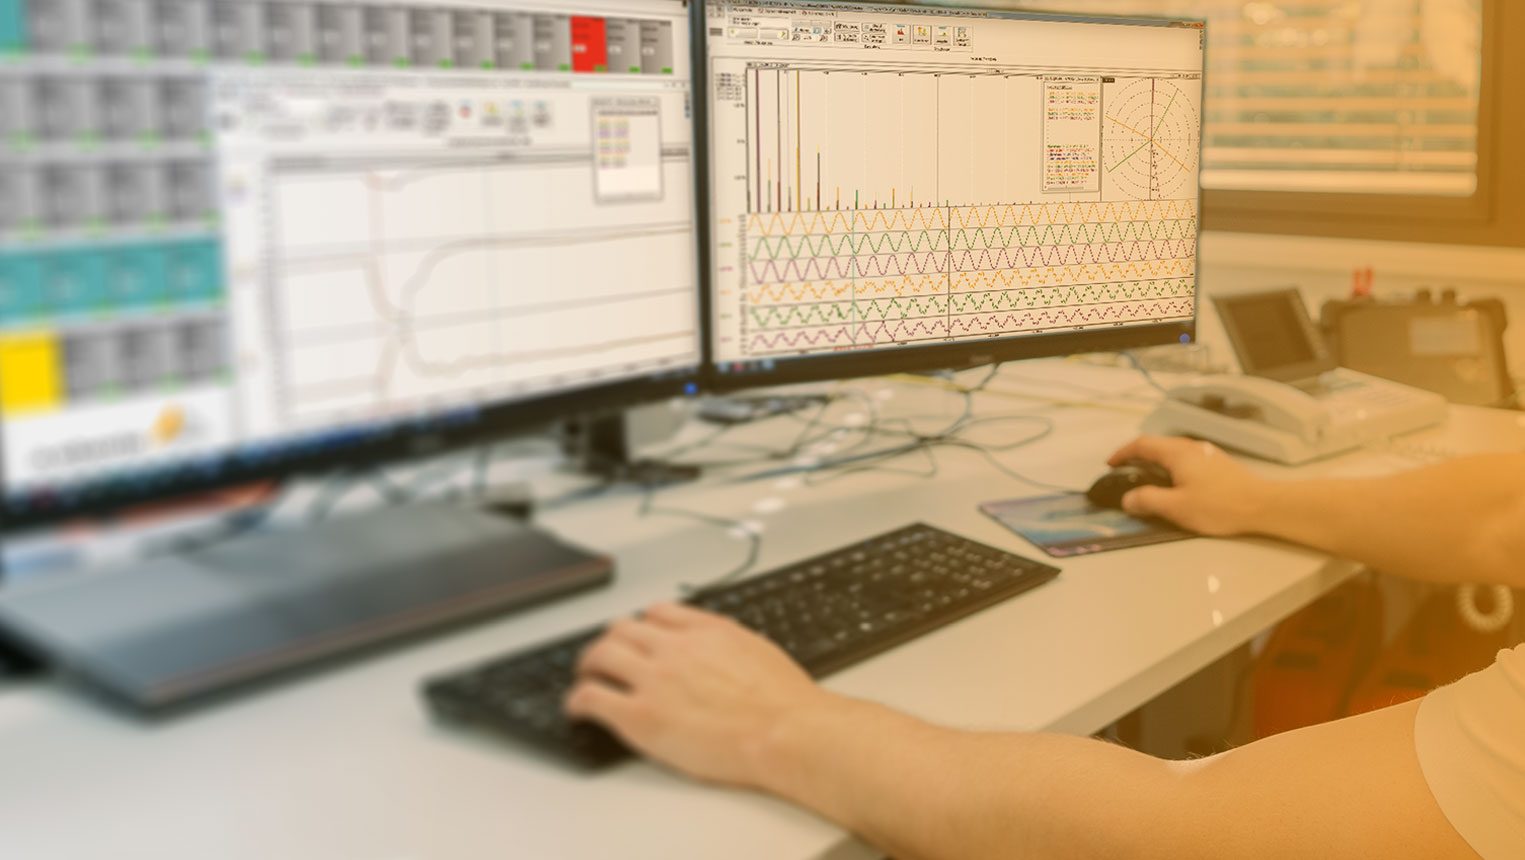
Display types in WinPQ mobile evaluation software
The WinPQ mobil evaluation software offers a variety of display options for the analysis of voltage and current harmonics. This in each case for long-term recordings over days or weeks or for a direct online analysis.
Figure 9 shows an example of an online analysis of the angles of the voltage and current harmonics in relation to the reference phasor fundamental phase L1 (vector at 0° phase position)
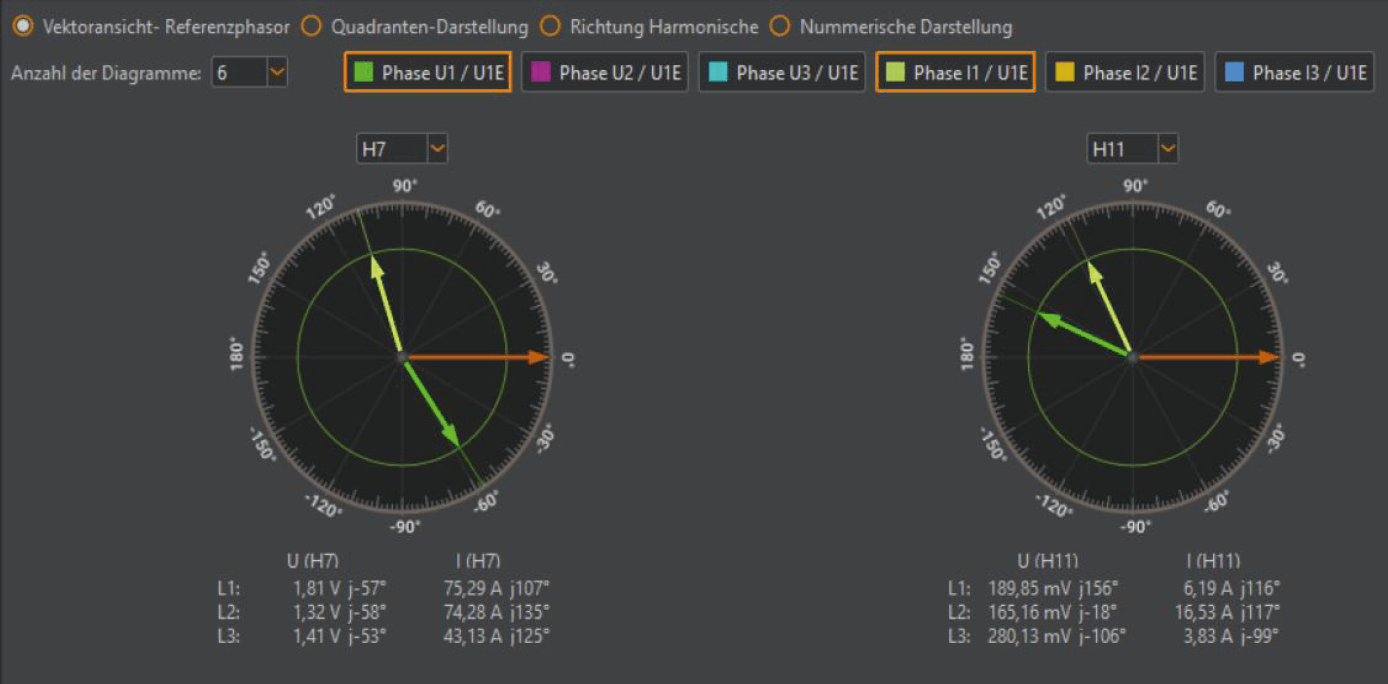
Statement of this display in WinPQ mobile:
The current harmonic H7 from this connected load has a favourable effect on the preloaded network. This can be seen in the difference of the phase angle of the preload in the network (here green vector with 1.22V) and almost 180° phase difference to the harmonic current (yellow vector with 15.6A).
A contrary statement is obtained for the 11th current harmonic with this measured consumer. Here, the already existing level on the voltage is worsened by this installation.
The angular reference of all harmonics is related to the fundamental of the corresponding conductor. This means that, for example, the angle of the 7th current harmonic of L2 is also related to the fundamental of phase L2. This has the advantage that identical angles are obtained for all three phases of a current or voltage harmonic. If all harmonics were always related to the fundamental of phase L1, the phase shift of the individual conductors of 120° would have to be taken into account additionally. However, a statement as to whether a consumer has a favourable or unfavourable effect at its connection, can be made independently in both ways.
Display of powers and quadrants in relation to the angle phi of the harmonics
Figure 10 shows another type of representation in WinPQ mobil and displays the active power of each harmonic with sign and phase position in the quadrant. A negative sign of the active power mathematically means a flow of energy from the consumer into the upstream grid. The apparent power and reactive power of all harmonics also appear at this point.
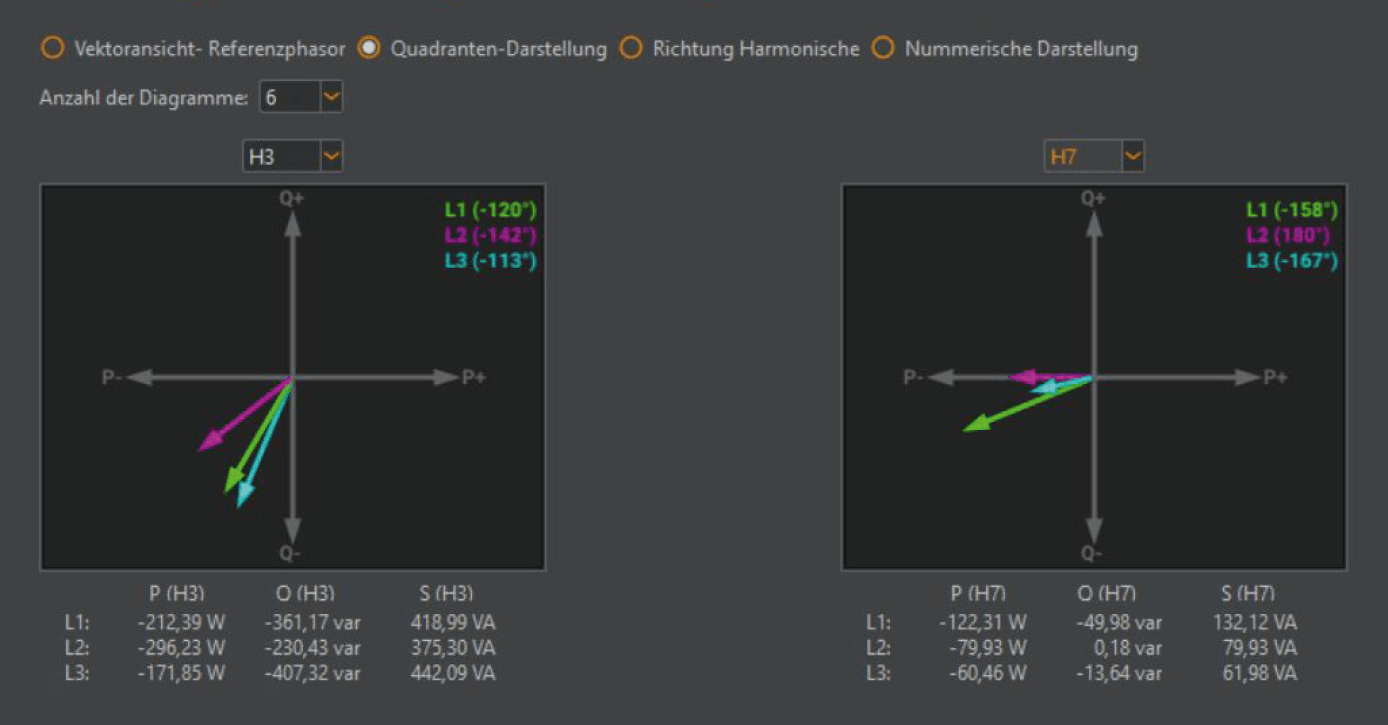
Voltage harmonics and current harmonics of the same frequency result in active power:
As with the fundamental power, an active power can also be calculated for each harmonic. The condition is, as already explained at the beginning, an active power calculation always only for equal frequencies. Since the phase angle ϕ can reverse the sign of the active power, it would be mathematically possible for a system to draw a higher fundamental active power from the grid than is then displayed in the measuring device or energy meter.

Here is a real example from practice in which an evaluation of the power flow direction could play a role. The reason for this measurement was differences in the energy measurement between different calibrated energy meters.
Very large B6 bridge rectifiers were installed in this system, which generated very high values of the 5th current harmonic of up to 400A in total. These large harmonic currents generated a 5th voltage harmonic of up to 26V in the grid.
From these high voltage values and current values of the 5th harmonic, an active power of max. 23kW results via the formula of the power calculation.
P_{2} = U_{2} * I_{2} * cosϕ_{2}
In the joint representation with the fundamental vibration active power, one recognises the opposite sign of the active power of the 5th harmonic active power in contrast to the fundamental vibration active power with positive sign.
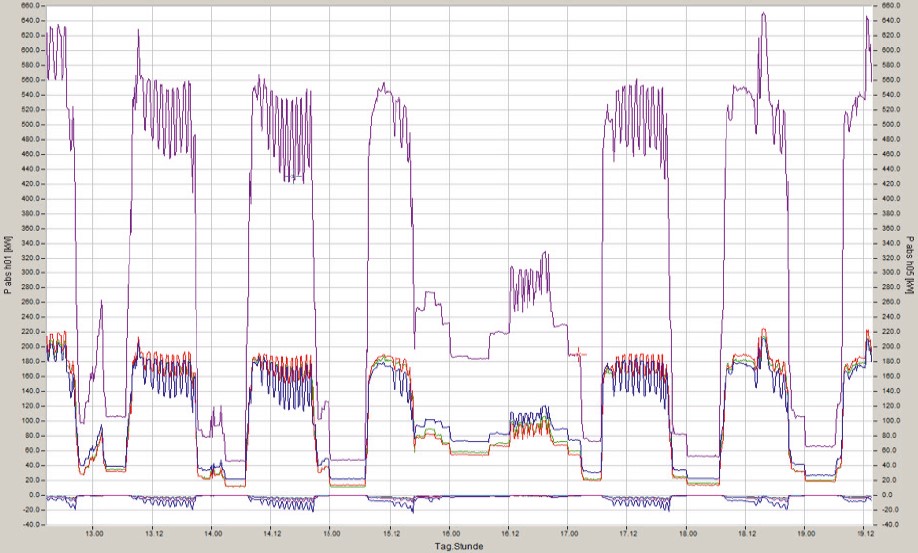
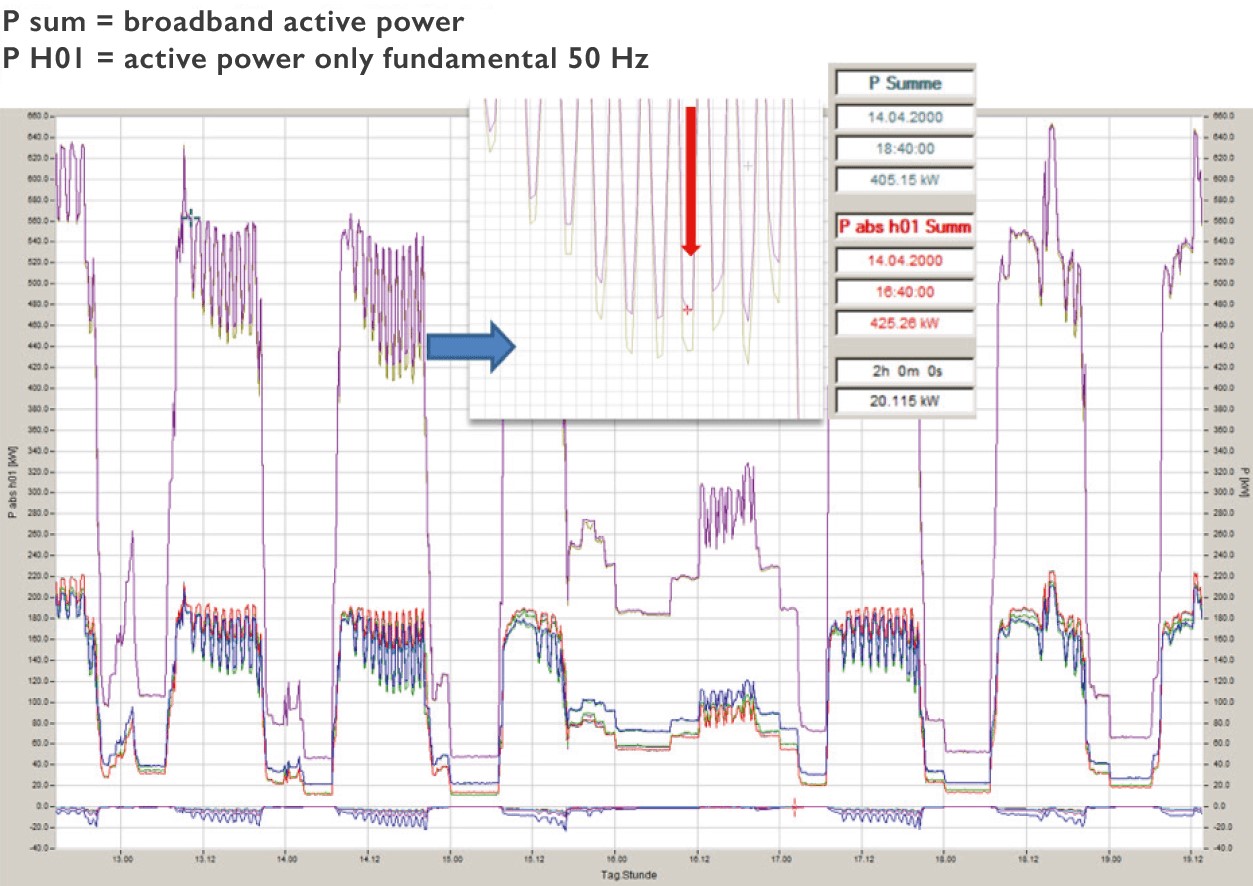
In this illustration in Figure 14, it can be seen that this system draws 50 Hz active power from the grid. Due to the high feedback effects of the 5th harmonic on current and voltage, a negative active power of the 5th harmonic results. This causes a reduction of the broadband calculated active power of this system. This is the power value that is also determined by an electronic meter. A Ferraris meter, which was also connected to this distribution, recorded an active power that was several percent higher.
Measurement error
It should be noted that the angle errors of current transformers and current clamps are strongly included in the measurement errors for the angle determination of harmonics. In medium-voltage measurements, the errors of voltage transformers are also included.
For example, an angular error of a current transformer of 1° causes an error of 15° Relative to the 15th harmonic. (15 x 50Hz)
It is also not insignificant what resolution the A/D input converters of a power quality network analyser have. On the one hand, it must be possible to detect very high currents on the fundamental frequency from the measuring device and current clamp set; on the other hand, very small current harmonics must be precisely resolved. Here, the use of 24-bit converters in contrast to 16-bit input converters shows a great advantage.