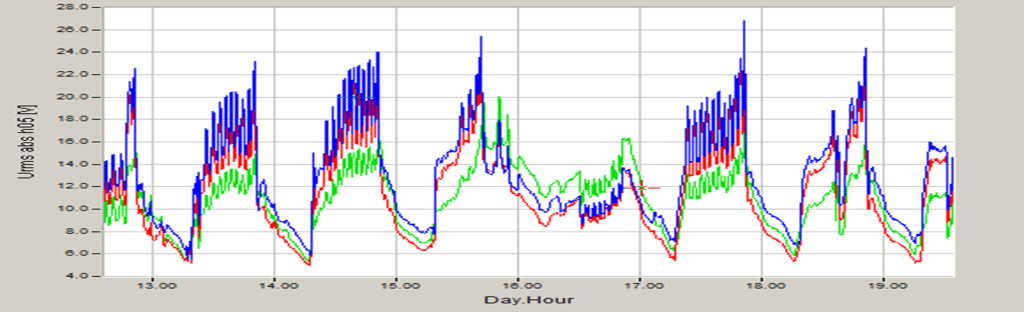
In this technical report, the analysis of a power measurement at a large industrial customer is performed. The customer experiences very large fifth harmonic currents and voltages during production time, resulting in poor power quality. The fifth harmonic reaches up to 26 volts and represents more than ten percent of the total power.
Backgrounds
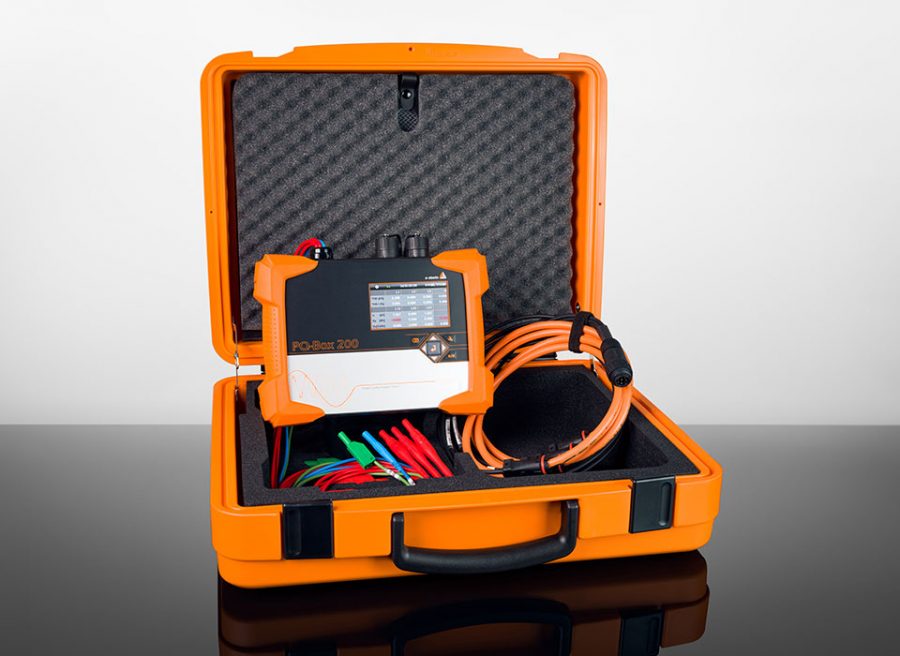
The background to the measurement arises from a situation where a utility had built a new station and operated two energy meters in series for a period of two months. The old station had a Ferrari´s meter, while the new station had an electronic meter. When energy was measured in parallel, it was noticed that the electronic meter was counting eight percent less energy than the Ferrari´s meter. After further testing and recalibration of the meters, it was determined that this large discrepancy remained. To clarify this discrepancy, a power quality measurement was performed (see Figure 1).
Network analyzers enable the quantification of harmonics
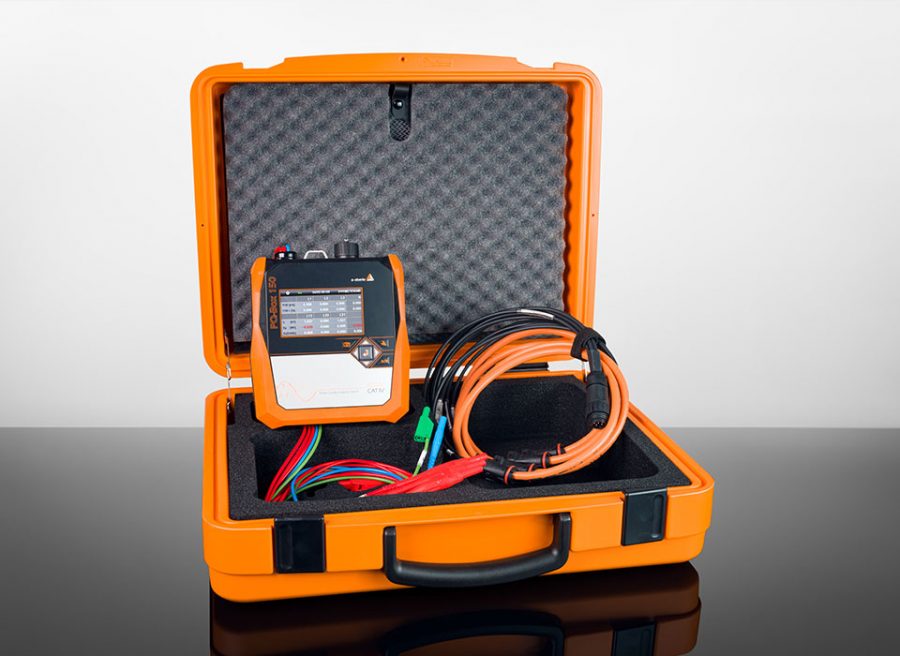
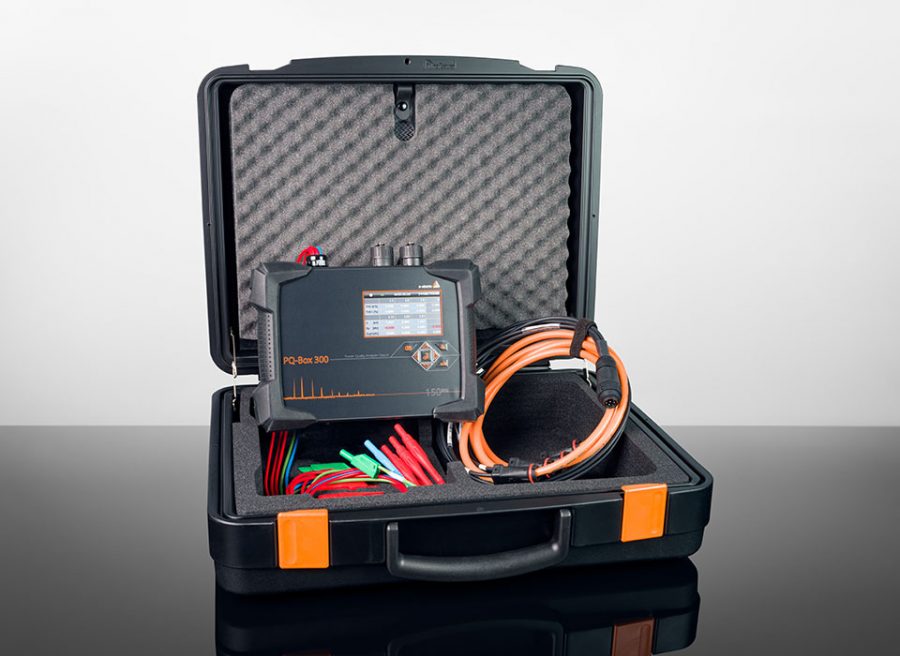
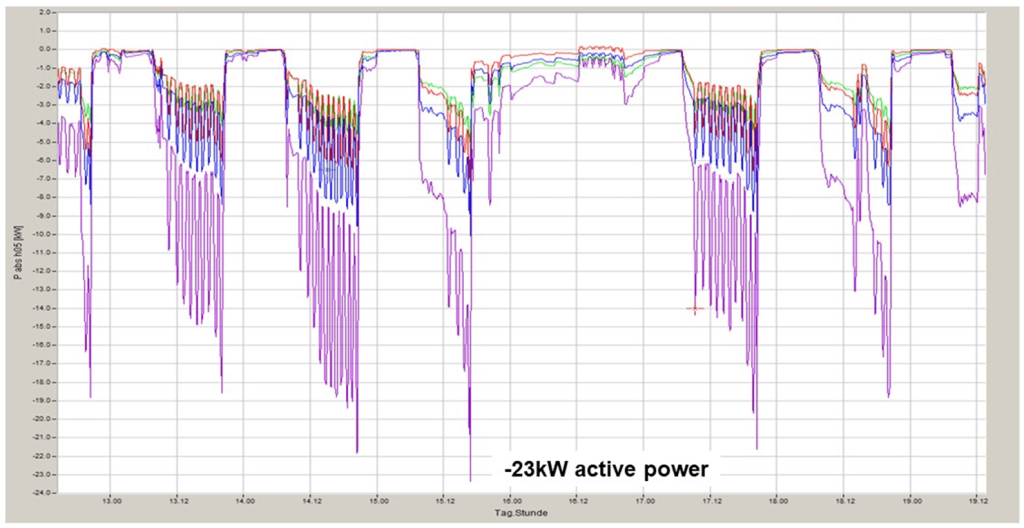
Our mobile power analyzers from the PQ Boxes family allows to quantify the voltage and current of these harmonics, taking into account the phase angle Phi. With this information, it is possible to accurately calculate the active power. The subsequent plot (Figure 2) illustrates the calculation of the active power using the measured data. The graph shows the active power of the individual phases and the three-phase power of the fifth harmonic (250 Hz). The analysis results in an active power of -23.3 kW. According to the definition, a negative value corresponds to a recovery of 23 kW of active power into the upstream grid on the part of the industrial customer at a frequency of 250 Hz.
Measurement data analysis
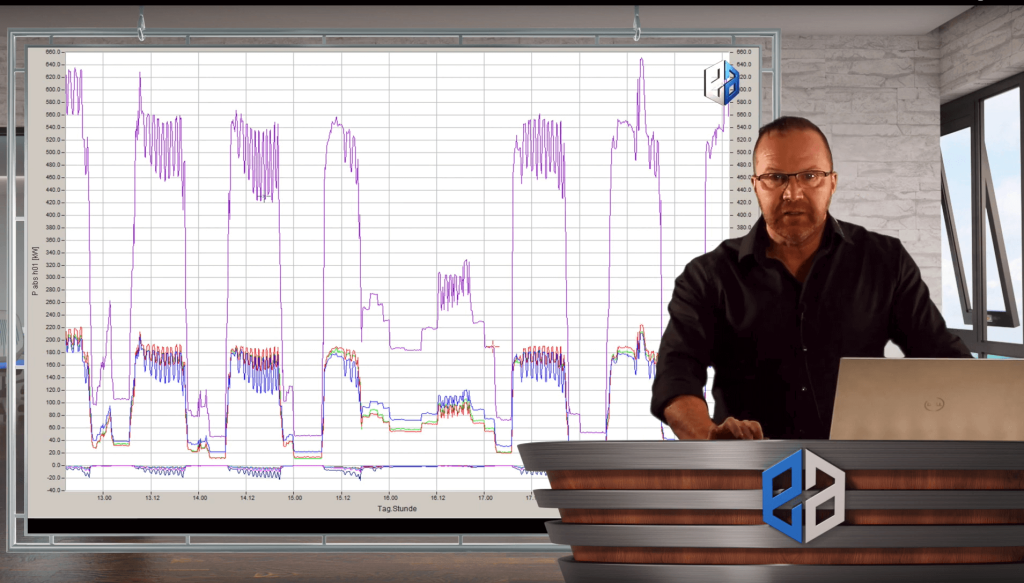
In the present measurement data, the customer’s total power is positive, which refutes the assumption of an incorrect connection configuration. The visual representation shows sum active power positive, while the fifth harmonic runs in the opposite direction with a negative sign (Figure 3).
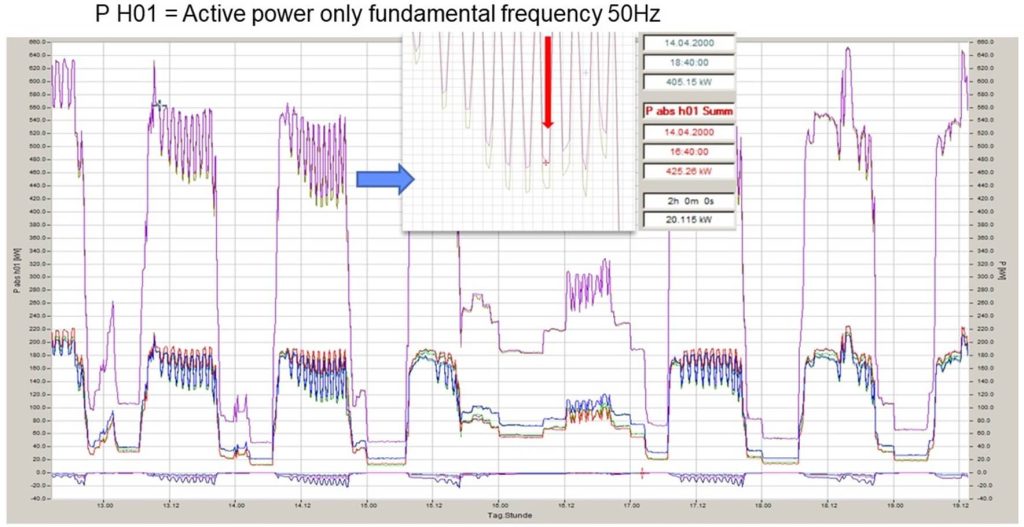
Is it necessary to subtract this harmonic active power quadratically from the sum active power? In this context, there is no need for a quadratic summation of the harmonics for the power calculation. Using the total power, the power of the fifth harmonic can be subtracted directly. This approach is in line with the possibilities offered by modern power analyzers and allows a precise quantification of the harmonic influences on the power level (Figure 4).

The graph in Figure 5 illustrates a level-time diagram showing the progression over a week. The two different colors in the graph represent the total power. The larger power value in purple shows the fundamental active power, while the smaller active power shows the broadband active power (i.e. including all harmonic powers).
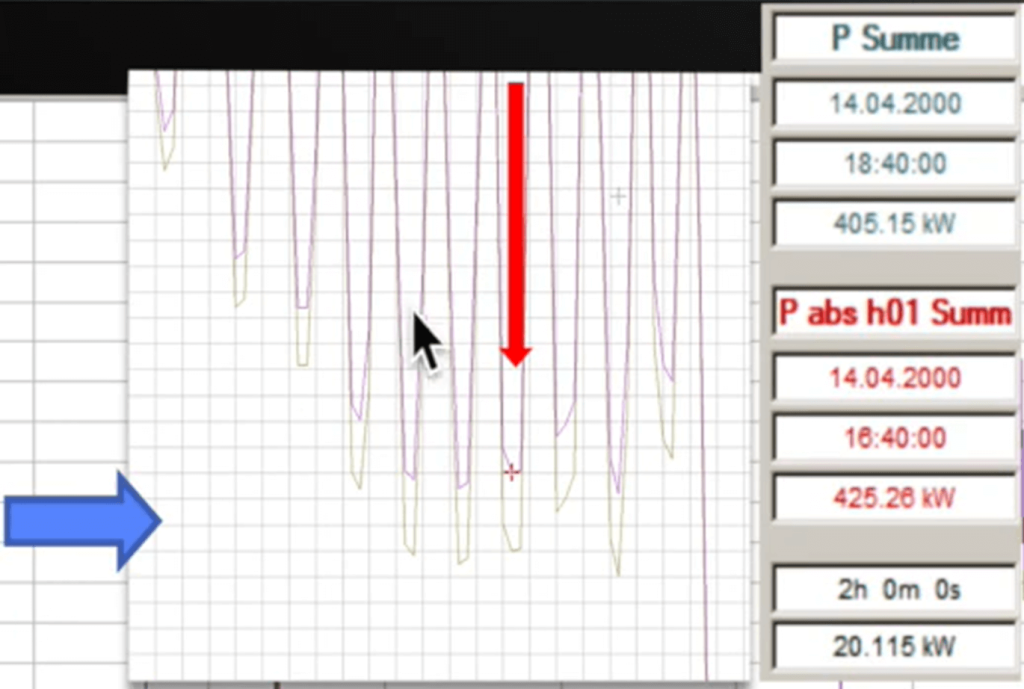
This customer draws a larger fundamental active power from the power grid and simultaneously introduces an active power of the fifth harmonic component in the opposite direction. This simultaneous influence causes the total sum of the broadband power to be slightly reduced. The discrete deviation between these two calculations of power thus represents the resulting difference of the two numerators (Figure 6).
In this context, the question arises as to the precise operation of the various types of meters. An electronic meter records not only the fundamental oscillation but also the harmonic powers. Rather, it acts like a power analyzer by calculating the power that has occurred based on the sampled voltage and current values. These readings produce a power curve, and depending on the sampling rate of the meter, accurate detection is usually up to half of that sampling rate. It is worth mentioning that a correct consideration of the flow direction of a harmonic component is done automatically by including appropriate deductions in the calculation, especially if the flow direction is oriented opposite to the main component.
A Ferrari´s meter, on the other hand, is usually specialized to measure the fundamental vibration active power. Thus, it turned out that the said meter recorded a slightly higher energy measurement. This can be seen especially in the present exceptional examples, where a difference of about eight percent was found. This discrepancy occurred despite the fact that both meters had been recently calibrated.
The results show that both meters are measuring correctly, but are using different measurement methods, resulting in the observed discrepancies.
Autor
Jürgen Blum, Produktmanager Power Quality Mobil